Download
1 / 35
350 likes | 370 Vues
This document provides an overview of the FY04 performance plan for the IT team and includes performance objectives, measures, customer survey scores, and actions to improve customer satisfaction, optimize IT budgets, and enhance customer relationships.

E N D
FY04 ORS Performance Management Manage Information Technology Team Members: Charlie Jones, Ben Ashtiani, Denny Bermudez, La'Tanya Burton, Ron Edwards, Robert Golshan, and Gail Williams January 9, 2005
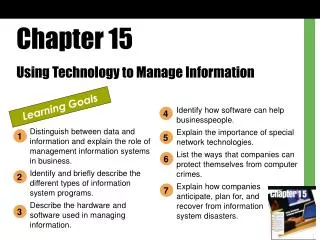
Overview • PMP Template • Value proposition and strategy • Performance objectives and measures • Customer Perspective: Critical Measures • Customer Survey Scores • Internal Business Process Perspective: Critical Measures • Learning and Growth: Critical Measures • Financial Perspective: Critical Measures • Conclusions and Actions
Customer Increase Customer Satisfaction Improve Customer Business Decisions Financial Internal Process Optimize Client’s IT Budgets Improve understanding Of customers’ needs Learning & Growth Learning & Growth Improve customer Relationships and core Ksa’s. Strategy Mapping Linkage – How to Satisfy Customers
Strategy Mapping Conclusions We concluded that IB1. Understanding our customers’ needs was the most critical objective in our plan to reach C3. Increase Customer Satisfaction. Strategy Map Analysis: • We can achieve our customer goal (C1.) Increased satisfaction if we focus on meeting (IB1.) Understand our customers’ needs. Reaching this goal will depend on our achieving (L1.) Improving our customer relationship and care skills.
Customer PerspectiveCritical Measure: C1.1, C2.1 C3.1 Customer Survey
Survey Distribution FY04 Administration Number of surveys distributed1,522* Number of respondents 443 Response rate 29% 229 respondents made comments (48%) on the survey *Note: Number distributed based on count of emails in the ORS and ORS global email list as of November 2003.
Who are you? Total N = 443 ORF N = 131 ORS N = 302
What kind of IT services did you use? Note: Multiple responses allowed.
FY04 IT Services SatisfactionRatings Compared to ORS Overall Unsatisfactory Outstanding
Cost Satisfaction RatingFrequency by Rating N = 443 Mean = 7.61 Median = 8 Note: Graph shows the distribution of responses by ratings selected.
Quality Satisfaction RatingFrequency by Rating N = 443 Mean = 7.72 Median = 8 Note: Graph shows the distribution of responses by ratings selected.
Timeliness Satisfaction RatingFrequency by Rating N = 443 Mean = 7.50 Median = 8 Note: Graph shows the distribution of responses by ratings selected.
Reliability Satisfaction RatingFrequency by Rating N = 443 Mean = 7.71 Median = 8 Note: Graph shows the distribution of responses by ratings selected.
Availability Satisfaction RatingFrequency by Rating N = 443 Mean = 7.73 Median = 8 Note: Graph shows the distribution of responses by ratings selected.
Responsiveness Satisfaction RatingFrequency by Rating N = 443 Mean = 7.67 Median = 8 Note: Graph shows the distribution of responses by ratings selected.
Convenience Satisfaction RatingFrequency by Rating N = 443 Mean = 7.61 Median = 8 Note: Graph shows the distribution of responses by ratings selected.
Competence Satisfaction RatingFrequency by Rating N = 443 Mean = 7.79 Median = 8 Note: Graph shows the distribution of responses by ratings selected.
Handling of Problems Satisfaction RatingFrequency by Rating N = 443 Mean = 7.66 Median = 8 Note: Graph shows the distribution of responses by ratings selected.
Estimated Satisfaction Scores Based on Types of Services Used Note: Multiple responses allowed.
What did the customer data tell us?What actions do we plan to take? • Pointed out areas where we need to address better delivery of ITB services • Demonstrated the relation between knowing customer needs and being able to quickly resolve problems • Feedback will be input for us to plan: • - more hands on training of staff for problem resolution • - more lessons learned – exchange of information sessions
Internal Business Processes PerspectiveCritical Measures: IB1.2 & IB2.1
Objective - IB1. Improve understanding of customer needsMeasure - IB1.2. No. of service requests tickets by all type
Objective - B1. Improve Transformation of Business requirements into solutionsMeasure - IB2.1. % of non-desktop Service Support handled by Infrastructure and Application Development Groups
What did the internal business process data tell us?What actions do we plan to take? • Identify the common problems and requests • Sets standards for our staff and contractors • Where our training and preparation should be focused based on the incoming requests • The ability of our staff to meet the specialized business needs – infrastructure and application support groups • Shows the trends of types of IT problems and needs • Move resources based on service requests • Use input for vendor training guidance and to plan for PBSC contracts of the future
Learning and Growth PerspectiveCritical Measures: L1.2 & L2.2
Objective: L1. Improve Customer relationship and care skillsMeasure: L1.2. First Contact Resolution Rate
Objective: L2. - Improve Institutional knowledge of customers businessMeasure: L2.2. Request problem tickets as "problem" type
What did the L & G data tell us?What actions do we plan to take? • Are we prepared to solve the problem immediately • We need to anticipate the types of calls and general queries • We may or may not have consistent responses to the same common problems or requests • We may have insufficient mix of staff for types of service requirements – too much call desk not enough infrastructure help • Examine the data and make action plans monthly based on the conclusions • Establish individual development plans that ensure we maintain competencies required to meet the needs identified in the data analysis
Financial PerspectiveCritical Measures: All ITB Branch is analyzing costs to determine correct unit costs for each Discrete Service for FY 06
FY 03 Ratio = 5:1 Final FY 04 Phone =71% Email = 8% FY 04 Ratio = 9:1
What did the Financial data tell us?What actions do we plan to take? • Industry standards demonstrate significant cost savings from handling Service requests of “all types” – by using web based fulfillment technology . Our ratio of 9 means that nine times more contacts for service or questions or general queries come to us by phone. Phone call service can be as high as $10 to $30 per call. Web based self serve solutions average $1.17 • A major self service web fullfillment initiative is needed.
Conclusions from PMP • The community relies on us for a one stop shop experience for total IT help • We have to be prepared to handle over 13,000 service requests and queries per year while maintaining high customer relationship standards • Our costs for service are excellent on a total census wide basis but we bear a big expense in using phone service rather than web based methods. • Key Initiatives • Implement web based service fulfillment • Analyze our cost by service performed to determine effective unit costs • Start preparing for conversion to PBSC’s for IT • Develop training and development plans to encourage competency sustainment for the future