Download
1 / 51
510 likes | 553 Vues
Developing a digital biomass atlas for national power generation assessment. Integrating remote sensing data and GIS layers, using AI techniques for crop identification. Accessible online for quick user reference. Collaboration with apex institutes and government bodies.

E N D
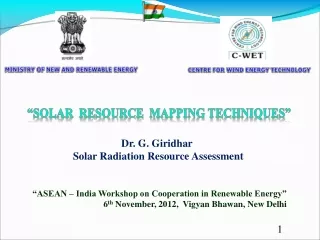
Biomass Resource Mapping Techniques Combustion, Gasification & Propulsion Laboratory (CGPL) Department of Aerospace Engineering Indian Institute of Science, Bangalore 560 012 http://cgpl.iisc.ernet.in
The Biomass Resource Mapping Initiative To develop a digital biomass atlas for at the national level to get an estimate on the biomass resources and their potential for Power Generation to be used by: Energy Consultants, Investors & Entrepreneurs Administrators & Financial Organizations Mapping of Biomass from Agro, Forest & Wasteland with an advanced feature of recognizing Biomass Surplus concentration centers using an image generated for each district with a predefined color gradient based on the Energy-useful Biomass Production index generated. To enable access of the atlas and data for users on internet for quick look.
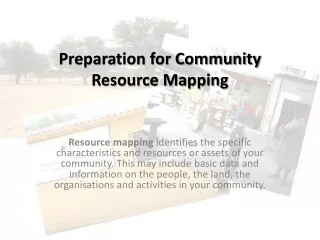
Some of the Key-Aspects for the Mapping Integration of Remote Sensing Data (RSD) into GIS layers The statistical biomass data - analysis and compilation Graphical Vectorisationfor the base GIS layers Strategies to identify Crop from RSD by their NDVI of LU signatures Strategies for Enhanced Reliability for Crop Identification – use of NDVI and Rainfall parameters with AI (artificial intelligence) techniques Options for comprehensive query responses for the users Options for dynamic queries with graphical and tabular results Resolve the data spatially to taluk or block level
The Basic Approach for using RSD GIS Tools:Geographical Information System is the technology containing the methodologies to define and access the geographical space and to automate the spatial data analysis by making use of computational power of computer. Land Use Mapping: is a description of how people utilize the land. Urban, Agricultural, Forest and Waste Lands are the most commonly recognised high-level classes of use. There would be many sub-classifications under these to define land uses properly.
Adaptation of NDVI • NDVI = Normalized difference Vegetation Index • It is defined as NDVI = (NIR — VIS) / (NIR + VIS) where NIR = Near infrared reflection and VIS = Visible reflection. • Spatial representation of Land use is done in GIS through irregular Polygons of different classes of NDVI. NDVI illustrated LU-Polygons- a graphic illustration
Land Use as seen by Satellite • Spatial representation of Land use is done by Satellite as an image seen by the IR and Visible light range camera. A sample for Karnataka is shown here: Tumkur Image Vectorization • The Image provides an index for Vegetation. This is used to group the respective similar Pixels and classified into Corresponding Land Use Polygons Called Vectors.
Types of Biomass • Biomass can be classified into three broad classes based on the type of land and the way it is generated as follows: • Agro-Biomass • Forest Biomass • Wasteland Biomass • The Biomass maps for these classes are done on different layers of GIS for the 8 states. • Agro-Biomass is the ‘by-product’ of the grown crops. • Forest Biomass are the residues generated in the densely vegetated areas having different species of plants. • Waste land is presently unused cultivable land defined to be worthy for afforestation.
The Scheme of the Ongoing Work AI:Apex Institute who Analyze & Validate the Survey Reports for Biomass Availability. SoI:Survey of India MoA: Ministry of Agriculture. NFP:National Focal Point do the data verification, Software development, Map generation and Web deployment of Biomass Resource Atlas. MNRE:Ministry for New and Renewable Energy – Project Sponsoring Ministry. ISRO: Indian Space Research Organization. NRSA: National Remote Sensing Agency. RRSSC: Regional Remote Sensing Service Center.
Reclassification of Agricultural Land Use (LU) Usage of the same LU Data for subsequent years (about 10), as long as the area under the agricultural activity in the selected zone remains roughly same – a feature generally true. Land use has been classified based on NDVI analysis of the earth surface temporally i.e. season-wise. Land use map for each state is available at Taluk level. It contains the agricultural land class polygons based on seasons- Kharif, Rabi, Kharif-Rabi. In the current method, polygons are classified into specific crops on the basis that same type of crop get into the same polygon due to ‘Implied NDVI’ for land use and Major crops go into larger polygons. AI is used to do the spatial distribution of Crops into Land use polygons using Major crops for larger polygons, Statistical Crop area and other prior data such as season and type of land use.
AI (Artificial Intelligence) in the Crop Classification It makes use of logical loops (if.. then.. else..) to decide the crop of a polygon depending on the sown area of statistical data. Crops are arranged in descending order of their crop area at the district level. The untagged polygons are considered successively in the order of their projected area. With the major crops getting distributed to large polygons the chances of selecting large polygons reduces. In a parallel and alternate approach polygons of agricultural land use are generated based on similar analysis with a value of NDVI (derived from RSD) in the area and so it is considered implied. Smaller polygons get classified into other crops depending on the terminal area required to conserve the reported statistical area.
Process of Making Agro-Biomass Digital Atlas Data Preparation Is Data Complete& OK? Verification Use a Grid at district level to Analyze and locate places of high biomass potential resources Integrate Data Prepare Map Spatially Distribute Preprocessing Is Data OK? Map Data Extract Prepare Atlas & Launch on Web
Classification of Agricultural Lands based on district level Crop Statistics
Non-Spatial Statistical Data at District Level Agro-crop statistics is taken at district level. Biomass generation from the crops are to be computed using a parameter - Crop Residue Ratio (CRR) defined by ratio of Residue Yield to Crop Yield. Following is a sample table showing result of mapping and analysis of the agro-biomass for the district of Kheda:
A typical analysis of mapping made for Agro-Biomass Surplus with Major Crops (Power Potential > 500MWe)
Result of Mapping of Agro-Biomass Surplus with Minor Residues (of power range 100 to 500MWe)
Agro-Biomass Surplus Minor Agro-Residues (Power potential 10 to 100MWe)
A Spatial View of Agro-Residues in Madhya Pradesh From Atlas, CGPL Site
A Demographic View of Madhya Pradesh From Atlas, CGPL Site
The Strategies for Mapping of Forest & Waste Lands • The spatial assessment of agro-biomass-power completed earlier is taken as the stage for further processing. Agro-biomass-power is estimated to be more than 16,000 MW of energy per year across the Country. • The residues available from forest & wasteland are added on these data layers. CRR [Crop Residue Ratio] is not applicable in the case of forest and wasteland residues. • Waste-Land is not well cultured with appropriate biomass growing plants. Based on the species mix available reports in forest area a first level estimate is predicted. • In this case, the biomass estimate is done using the yield of the residue.
Significance of Existing Utilization Pattern of Biomass from Forest & Waste Land in the Mapping Strategy Given the inefficiency of administration and the ‘soft’ character of the political system, one could generalize that from a typical tree, the stem goes to the rich and the towns, while the branches and twigs belong to the poor. Human needs for biomass are, however, not restricted to the consumption and use of woody biomass. The maintenance of life support systems is a function performed mainly by the crown biomass of trees. It is this component of trees that can contribute positively towards the maintenance of the hydrological and nutrient cycles.
Social forestry is also the most important source for the production of biomass for consumption as fuel, fodder, manure, fruits, etc. • Social forestry as distinct from commercial forestry is supposed to be corrective aimed at the maximization of the production of all types of useful biomass which improve ecological stability. • The appropriate unit of assessment of growth and yields of different tree species for social forestry programmes cannot be restricted to woody biomass production for commercial use. It must, instead, be specific to the end use of biomass. Significance of Existing Utilization (Contd…)
Evidently, the crisis in biomass for mulching or animal feed cannot be resolved by planting trees that are fast growing and are absolutely unproductive as fodder. • The assessment of yields in social forestry must include diverse types of biomass which provide inputs to agro ecosystems. When the objective of tree planting is the production of fodder or green fertilizer, it is relevant to measure crown biomass productivity. • Keeping these factors in mind Wasteland has to be developed with Plantations suitable for energy. • For the present, species available in Forest area are considered to be extended to Waste land area for the purpose of Biomass assessment for Energy. Significance of Existing Utilization (contd...)
Some Observations on Forest & Wasteland Biomass • It is reported by FSI that the plantation density varies depending on the type of forest. FSI has published forest area based on the plantation density (next slide). • The plants / trees species pattern grown in the forests are heterogeneous unlike agricultural crops. FSI has given % mix of these species in each state & nation wide (slide follows). • Some of these species are leafy, some others generate more of twigs, some of them generate twigs-leaf-bark. Generation of bark also depends on the stem size. • Though we do not get direct relations between these factors, there are some estimations available through internet sources and FSI regarding residue yields (slide follows).
Forest Plantation Density Density Classification & Percentage Concentration (FSI):
Twigs Bark Branches Leaves – Crown Biomass
Method of Approach for the Assessment Mapping • Initially the biomass in forest was assessed without considering the plantation density for a quick analysis to enable the process development. • Later based on the observations the mapping was reclassified into sub-classes for low and high density areas using ground reference points. • This called for re-processing of image and spatial classifications. The mapping was reworked with this modified classifications. • There has been a significant enhancement in the reliability factor in the estimation of biomass surplus on this approach.
Method of Approach for the Assessment Mapping (Contd…) • With the species spread being heterogeneous and their mix being known for each state, they could be spatially distributed to the Forest and Waste Land zones appropriately in the mapping. • The a specialized database is created from these distributions from the maps that preserves the essential characteristics of the analysis and mapping made. • The algorithm for arriving at the biomass assessment is much similar to Agro-Biomass assessment as was described earlier.
Merging of Mapping for Residues from Agro, Forest and Waste Land • The Biomass surplus assessed separately for agro, forest and waste land are integrated into a database. • The database is further queried to provide aggregated biomass data with power potential for any combination such as- (Agro & Forest), (Agro & Wasteland), (Agro & Forest & Wasteland), etc. • The biomass data generated is further used to generate image maps for each state indicating the biomass production index over the respective spatial region of the state (Slides follow).
Spatial Data of Forest Residues in Sidhiof Madhya Pradesh Forest
Spatial Wasteland based Resource Map for Sidhi of Madhya Pradesh Waste Land
Sidhi of Madhya Pradesh Agro, Forest & Wasteland Biomass Contd…
Sidhi of Madhya Pradesh Agro, Forest & Wasteland Biomass Contd…
A Concept Evolved - Biomass Production Index • After the different types of biomass are spatially distributed into different layers, it is necessary that the ‘biomass concentration centers’ be identified based on the aggregation of biomass surplus of all types. • To aid this activity a reverse process of generating an image based on the total surplus biomass from all the layers- Agro, Forest and Wasteland of map data is generated. • This is done by coloring the geographical area based on a normalized index of the total biomass surplus for each district.
Meshing of Gujarat for Biomass Production Index (BPI) and Resulting Contours of Production for Rajkot District
Biomass Production Index • In the previous slide image generated for BPI is shown as an example. • In the district Rajkot of Gujarath it is now easy to point to the areas of high biomass concentration. The green areas are more biomass productive for the purposes of energy generation. • This is also verified by making a graphical query on this chosen geographical area. For example if a query is made on the red region it shows low energy-useful biomass production.
Concluding Remarks • The mapped biomass resource atlas is hosted on a internet site (http://cgpl.iisc.ernet.in) and is available for an end user to access from anywhere. • The usage of the atlas is found fairly good (typically 150-250 visits per day) by aspirant entrepreneurs and administrators in decision making. • Expansion of the data sets and features are ongoing for enhanced features and performance. • The mapping has provided a strong basis of building sustainable and efficient biomass power plants – a well recognized and emerging renewable alternative energy source. • The study points out that availability of biomass as fuel is generally not the hindrance for its wider applicability but it needs to have a proper organized approach to overcome the barrier, as of today.