Download
1 / 13
130 likes | 241 Vues
This report presents an analysis of health care coverage disparities among different social groups in Mexico, focusing on maternal health services such as antenatal care, skilled birth attendance, and cervical cancer testing. Utilizing data from the National Survey of Health System Performance, it highlights geographic, income, and marginality-related inequalities. Challenges in implementing health reforms are discussed, emphasizing the need for targeted strategies to enhance service coverage in disadvantaged populations, and suggesting that individual coverage assessments can aid in monitoring progress.

E N D
Inequalities in Coverage:social groups differences in Mexico Rafael Lozano MD MSc Inequalities in Financing and Health: Measurement Frameworks and Challenges for Implementing Reforms Mexico City, 22 April 2004
Coverage Antenatal care Skilled birth attendance Cervical cancer test Inequalities Geographical distribution Income Marginality Measurements
National Survey of Health System Performance (NSHSP) • Multistage Stratified Random Cluster Sample eachstage selection with a known probability • National and subnational representative • Sample Size 38,740 households • Data collection 5 months • Household duration 85 minutes average
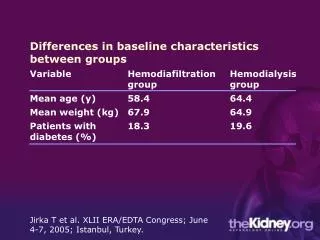
Antenatal Care vs Maternal Mortality 120 Tlaxcala Yucatán 100 80 MMR per 100,000 LB 60 40 Tabasco BC 20 0 60% 70% 80% 90% 100% Coverage % Coverage 64-80 81-85 85-95 Antenatal Care Coverage Sources: ENED, 2003. INEGI/SSA 2002
Neonatal mortality vs Skilled birth attendance coverage 20 18 16 Rate x 1000 LB 14 12 10 8 0.60 0.70 0.80 0.90 1.00 Coverage Skilled Birth Attendance % Coverage 63-90 91-95 96-98 Sources: ENED, 2003. INEGI/SSA 2002
Cervical Cancer Mortality vs Detection Coverage 20.0 15.0 10.0 Rate x 100,000 women 25-64 5.0 0.0 0.50 0.53 0.56 0.59 0.62 0.65 Coverage Cervical Cancer Detection % Coverage 48-56 57-60 61-65 Sources: ENED, 2003. INEGI/SSA 2002
Skilled Birth Attendance 1 .9 .8 Coverage .7 .6 .5 1 2 3 4 5 6 7 8 9 10 permanent income by decile - Cervical Cancer detection 1 .9 .8 Coverage .7 .6 .5 1 2 3 4 5 6 7 8 9 10 permanent income by decile Antenatal care 1 .9 .8 Coverage .7 .6 .5 1 2 3 4 5 6 7 8 9 10 Permanent income by decile
Level Population Municipalities Very Low 53.6 10.1 Low 14.0 37.1 Medium 12.0 19.9 High 15.7 17.1 Very High 4.7 15.8 104* 2,442 Marginality Index, Mexico 2000 • Census Variables • Illiteracy population > 15 years old • Incomplete elementary > 15 years old • Household conditions • 3. without electricity • without sewage • Without drinking water • Earth floor • Overcrowding • < 2500 population • Very low Income (> 2 min salary) • Factor Analysis • Transformation to Z units
Low marginality Medium marginality Very Low marginality 1 1 1 .9 .9 .9 .8 .8 .8 .7 .7 .7 .6 .6 .6 1 2 3 4 5 1 2 3 4 5 1 2 3 4 5 permanent income by quintile permanent income by quintile permanent income by quintile Very High marginality High marginality 1 1 Antenatal Care Coverge Income by quintile and level of Marginality, Mexico 2003 *Sources: NSHSP, 2003 CONAPO 2000. .9 .9 .8 .8 .7 .7 .6 .6 1 2 3 4 5 1 2 3 4 5 permanent income by quintile permanent income by quintile
Very Low marginality Low marginality Medium marginality 1 1 1 .9 .9 .9 .8 .8 .8 .7 .7 .7 .6 .6 .6 1 2 3 4 5 1 2 3 4 5 1 2 3 4 5 income by quintile income by quintile income by quintile - Very High marginality High marginality 1 1 Skilled Birth Attendance Income by quintile and level of Marginality, Mexico 2003 *Sources: NSHSP, 2003 CONAPO 2000. .9 .9 .8 .8 .7 .7 .6 .6 1 2 3 4 5 1 2 3 4 5 income by quintile income by quintile
Very Low marginality Low marginality Medium marginality .7 .7 .7 .6 .6 .6 .5 .5 .5 .4 .4 .4 .3 .3 .3 1 2 3 4 5 1 2 3 4 5 1 2 3 4 5 income by quintile income by quintile income by quintile High marginality Very High marginality .7 .7 Cervical Cancer Test Income by quintile and level of Marginality, Mexico 2003 *Sources: NSHSP, 2003 CONAPO 2000. .6 .6 .5 .5 .4 .4 .3 .3 1 2 3 4 5 1 2 3 4 5 permanent income by quintile -country- permanent income by quintile -country-
Fifth Quintile Fourth Quintile First Quintile Second Quintile 1 0.9 0.8 0.7 0.6 0.5 0.4 0.3 1 Very high high medium low Ver ylow 0.9 0.8 0.7 0.6 0.5 0.4 0.3 Very high high medium low Very low 1 1 0.9 0.9 0.8 0.8 0.7 0.7 0.6 0.6 0.5 0.5 0.4 0.4 0.3 0.3 Very high medium low Very low high Very high high medium low Very low Cervical Cancer TestT Antenatal Care Skill Birth Attendance Effective Coverage by level of marginality and Income quintile
High correlation between low coverage and low income but not necessarily with high marginality Refocus the strategy of extent coverage in the reform process Continue with the measurements of inequalities Individual Coverage is a useful measurement for follow up the investments of reform process Total inequality is a function of between-group and within-group inequality Conclusions