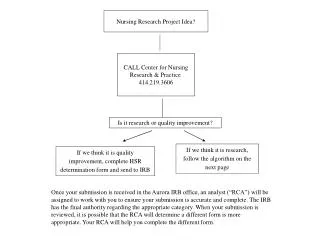
When Is Quality Improvement Research?
This presentation by Dr. Christopher J. Crnich discusses the complexities of Quality Improvement (QI) research in healthcare. It reviews the hierarchy of evidence, challenges, and misinterpretations surrounding QI studies, particularly in acute and long-term care settings. The session highlights the necessity of improving methodological quality in QI research and debates the traditional views of QI as merely a practical application of proven interventions, underscoring its potential to generate valuable knowledge. The exploration includes historical context, examples, and calls for rigorous academic acceptance of QI.

When Is Quality Improvement Research?
E N D
Presentation Transcript
When Is Quality Improvement Research? Christopher J. Crnich, MD MS November 15, 2008
Outline • Hierarchy of evidence • Misconceptions about the hierarchy • Evidence of QI = research • Acute care • Long-term care • Potential limitations of QI research • Improving methodological quality of QI research
A Short History of Medicine 2000 BC “Here, eat this root.” 1000 AD “That root is heathen. Here, say this prayer.” 1850 AD “The prayer is superstition. Here, drink this potion.” 1920 AD “That potion is snake oil. Here, swallow this pill.” 1945 AD “That pill is ineffective. Here, take this penicillin.” 1955 AD “Oops… bugs mutated. Here, take this tetracycline.” 1960-1999 AD “Thirty-nine more “oops”… Here, take this more powerful antibiotic.” ~2000 AD “The bugs have won! Here, eat this root.” Anonymous, World Health Report on Infectious Diseases 2000
Results from Observational Studies of Combined Hormone Therapy and from the Women's Health Initiative and the Heart and Estrogen/Progestin Replacement Study Grodstein, F. et al. N Engl J Med 2003;348:645-650
Hierarchy of Research Evidence Quality Improvement Projects?
Hierarchy on Shaky Ground Benson et al. N Engl J Med 2000; 342: 1878-1886
The Tyranny of the RCT • "the claims for the RCT have been greatly, indeed preposterously overstated. The truth of the matter is that the RCT is one of many ways of generating information, of validating hypotheses. The proponents of the RCT, however, have elevated what is in theory a frequent (though by no means universal) advantage of degree into a gulf as sharp as that between the kosher and the non-kosher.” • Charles Fried
Weaknesses of RCTs • Cannot be used to assess effects of potentially hazardous exposures • Traditionally examine efficacy not effectiveness • Difficulty with context • Have difficulty analyzing complex interventions
Are RCTs the only way to learn? • “The difference between the RCT and the observational, retrospective study is not the difference between good and bad science, truth or falsity, but a difference between varying degrees of confidence.” • Charles Fried
Traditional View of QI • Focused on implementing proven intervention in the real world (effectiveness) • Primary objective is to improve patient care, gain of knowledge is secondary • Local focus (not generalizeable) • Minimal statistical analysis • Not a viable form of academic productivity
Can QI be Research? • It depends • From IRB perspective, no • From academic advancement perspective, yes • Like RCTs and causal epidemiologic studies QI (when done right) can be used to: • Generate new knowledge • Generalize that knowledge to other settings • Increasing methodological rigor of QI has been the key to academic acceptance
NOSOCOMIAL BSI:IVD-RELATED BSIs • ~200 million IVDs/year in U.S. • ~0.2-5% risk of IVD-related BSI • Attributable mortality ~ 5% • Incremental costs $12,000/case • ~500,000 IVD-related BSIs in U.S. each year, ~25,000 deaths
Guideline Compliance • Education program (52%) • Routine exchange of CVCs (25%) • Appropriate hand hygiene (17 – 60%) • Insertion in subclavian vein (31 – 60%) • Maximal sterile barriers during insertion (28 - 58%) • Chlorhexidine for insertion site preparation Alonso-Echanove et al. Infect Control Hosp Epidemiol 2003 Braun et al. Infect Control Hosp Epidemiol 2003 Coopersmith et al. Arch Intern Med 2004 Warren et al. Infect Control Hosp Epidemiol 2006
QI Project to Reduce CVC-associated BSIs P < 0.0001 P < 0.0001 P < 0.0001 P = 0.04 Eggiman et al. Lancet 2000; 355(9218): 1864-8
Intervention 1: Education of staff • Intervention 2: Creation of CVC insertion cart • Intervention 3: Asking if CVC can be removed daily • Intervention 4: Nurse completed checklist • Intervention 5: Empowerment of nurses Crit Care Med 2004; 32(10): 2014-20
Program Expansion: The Michigan Keystone Project Pronovost et al. N Engl J Med 2006; 355(26): 2725-32
Program Expansion: The Michigan Keystone Project Pronovost et al. N Engl J Med 2006; 355(26): 2725-32
Antimicrobial Use in LTCFs • Accounts for 20-40% of the medications used in LTCFs • 3-13% of residents are receiving antimicrobials at any time • 40-70% of residents will receive at least one antibiotic during 6 months of follow-up • 25-75% of antibiotics given for inappropriate indications
Antimicrobial Use in LTCF Mylotte, AJIC 1999; 27:10-19
Antimicrobial Use in LTCF Mylotte, AJIC 1999; 27:10-19
Antimicrobial Use in LTCF Mylotte, AJIC 1999; 27:10-19
Antimicrobial Use in LTCFs Mylotte, AJIC 1999; 27:10-19
Phase 1: Antibiotic utilization review • Phase 2: Physician contact and guideline development • Phase 3: Intervention deployment • Pocket cards with Abx use guidelines • Caregiver lectures • Weekly antibiotic rounds • Targeted feedback to outliers J Am Geriatr Soc 2004; 52(1): 112-6
J Am Geriatr Soc 2004; 52(1): 112-6 P < 0.001 P = 0.08
J Am Geriatr Soc 2007; 55(8): 1236-42 • Point prevalence study of antibiotic resistance (1998) • Development of antimicrobial utilization methods (2000) • Teaching and guideline intervention • Targeted internists and nursing leaders • Case-based education • Dissemination of algorithms and guidelines
J Am Geriatr Soc 2007; 55(8): 1236-42 -12.1%, NS -29.7%, P < 0.001 -25.9%, P = 0.06 -22.2%, NS Antibiotic-resistant infections (per 1,000-days) 25%
Limitations of QI Research • Internal validity problems • Construct validity problems • Statistical validity problems • External validity problems
Internal Validity Problems • Confounding factors, history • Trends/maturation effects • Seasonal effects • Detection bias • Attrition bias • Selection bias • Regression to the mean effects
Internal Validity Problems • Confounding factors, history • Trends/maturation effects • Seasonal effects • Detection bias • Attrition bias • Selection bias • Regression to the mean effects
Confounding • Problem • Many features of care can change over time (intentional and unintentional) • Reduces ability to infer causal benefit (or lack thereof) of intervention • E.g., MRSA control programs • Potential solutions • Make inventory of potential care practices that can influence outcome of interest • Seek to measure major confounders along with intervention • Adjust for confounding in analyses • When not feasible, fess up in your limitations section
Determinants of MRSA Control Amox/Clav 3GCP Alch HH Alch Wipes Macrolide Fluoroquinolone ASC Admit MRSA Aldeyab et al. J Antimicrob Chemother 2008; 62(3): 593-600
Confounding • Problem • Many features of care can change over time (intentional and unintentional) • Reduces ability to infer causal benefit (or lack thereof) of intervention • E.g., MRSA control programs • Potential solutions • Make inventory of potential care practices that can influence outcome of interest • Seek to measure major confounders along with intervention • Adjust for confounding in analyses • When not feasible, fess up in your limitations section
Internal Validity Problems • Confounding factors, history • Trends/maturation effects • Seasonal effects • Detection bias • Attrition bias • Selection bias • Regression to the mean effects
J Am Geriatr Soc 2007; 55(8): 1236-42 Δ, P = ???
J Am Geriatr Soc 2007; 55(8): 1236-42 Δ, P = ???
Dealing with Maturation Effects • Multiple data points • Utilize time series statistical methods for analyses • Segmented regression • ARIMA (autoregressive integrated moving average) • Present data visually
Internal Validity Problems • Confounding factors, history • Trends/maturation effects • Seasonal effects • Detection bias • Attrition bias • Selection bias • Regression to the mean effects
Spurious associations can occur because of: • Seasonal staffing fluctuations • Seasonal fluctuations in illness • Examples: • Initiating a MRSA control program as the influenza season was ending • Fluctuating effectiveness of influenza vaccine programs due to year-to-year differences in virulence of virus and vaccine-virus match • Solutions • Exam effects of interventions across seasons (years) Emerg Infect Dis 2006; 12(6): 894-9
Internal Validity Problems • Confounding factors, history • Trends/maturation effects • Seasonal effects • Detection bias • Attrition bias • Selection bias • Regression to the mean effects
Ventilator-Associated Pneumonia Rates: UW Hospital (Hypothetical) ICP #1 ICP #2 ICP #1 VAP Rate (per 1,000 vent-days) UCL Date