sh-Control
HBL100. 1.2. sh-Control. sh-Control. sh-Rictor. sh-Rictor. 1.0. sh-Raptor. sh-Raptor. sh-mTOR. sh-mTOR. 0.8. MTT Metabolization (A 570 ). 0.6. 0.4. 0.2. 0. 0. 1. 2. 3. Days. A. sh-Control. sh-Rictor. sh-Raptor. sh-mTOR. sh-mTOR. sh-Control. sh-Raptor. sh-Rictor.

sh-Control
E N D
Presentation Transcript
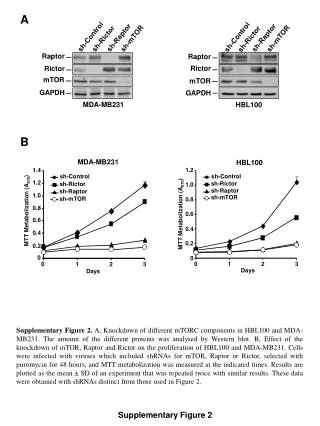
HBL100 1.2 sh-Control sh-Control sh-Rictor sh-Rictor 1.0 sh-Raptor sh-Raptor sh-mTOR sh-mTOR 0.8 MTT Metabolization (A570) 0.6 0.4 0.2 0 0 1 2 3 Days A sh-Control sh-Rictor sh-Raptor sh-mTOR sh-mTOR sh-Control sh-Raptor sh-Rictor Raptor Raptor Rictor Rictor mTOR mTOR GAPDH GAPDH MDA-MB231 HBL100 B MDA-MB231 1.4 1.2 1.0 0.8 MTT Metabolization (A570) 0.6 0.4 0.2 0 0 1 2 3 Days Supplementary Figure 2. A, Knockdown of different mTORC components in HBL100 and MDA-MB231. The amount of the different proteins was analysed by Western blot. B, Effect of the knockdown of mTOR, Raptor and Rictor on the proliferation of HBL100 and MDA-MB231. Cells were infected with viruses which included shRNAs for mTOR, Raptor or Rictor, selected with puromycin for 48 hours, and MTT metabolization was measured at the indicated times. Results are plotted as the mean ± SD of an experiment that was repeated twice with similar results. These data were obtained with shRNAs distinct from those used in Figure 2. Supplementary Figure 2