Download
1 / 51
510 likes | 517 Vues
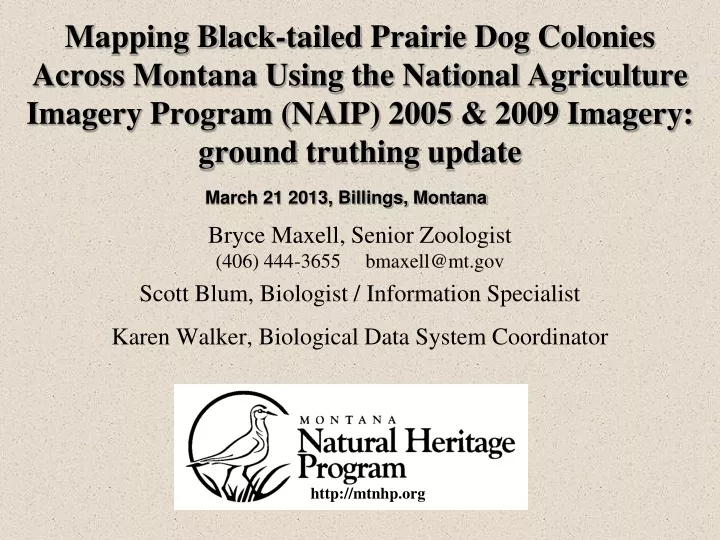
http://mtnhp.org. Mapping Black-tailed Prairie Dog Colonies Across Montana Using the National Agriculture Imagery Program (NAIP) 2005 & 2009 Imagery: ground truthing update. March 21 2013, Billings, Montana. Bryce Maxell, Senior Zoologist (406) 444-3655 bmaxell@mt.gov

E N D
http://mtnhp.org Mapping Black-tailed Prairie Dog Colonies Across Montana Using the National Agriculture Imagery Program (NAIP) 2005 & 2009 Imagery: ground truthing update March 21 2013, Billings, Montana Bryce Maxell, Senior Zoologist (406) 444-3655 bmaxell@mt.gov Scott Blum, Biologist / Information Specialist Karen Walker, Biological Data System Coordinator
Montana’s Conservation Plan forBlack-tailed and White-tailed Prairie Dogs Objective #2 - develop statewide and regional prairie dog distribution and abundance standards - Inventory and monitor distribution and abundance - 1.5 km complexes of 5,000, 1,000-5,000, and <1,000 acres (Biggins et. al. 2006) Objective #3C – identify isolated prairie dog colonies in need of special consideration, assess their needs, and implement special management tasks, as appropriate
Weaknesses in Current Spatial Representation Datum Shift?
Weaknesses in Current Spatial Representation Missed Town
Weaknesses in Current Spatial Representation • Shifted PolygonsMissed ColoniesGround Mapping Limitations (can’t see the town for the burrows)
National Agriculture Imagery Program • Administered by USDA Farm Service Agency • 4 bands of information (red, green, blue and near infrared) gathered during growing season in continental U.S. to yield both natural color and color infrared imagery • Acquired at 1-meter ground sample distance or resolution (i.e. each pixel = 1 square meter) • Horizontal accuracy = 6 meters • Montana first flown in 2005 (available in 2006) • MT flown again in 2009 (available March 4, 2010) • MT will be flown in 2011 (3-band only 1-meter resolution) • Add 2009 NAIP to ArcMap under ArcGIS Server Connection http://gisservice.mt.gov/arcgis/services/
http://www.fsa.usda.gov/FSA/apfoapp?area=home&subject=prog&topic=naihttp://www.fsa.usda.gov/FSA/apfoapp?area=home&subject=prog&topic=nai
Goals • Use NAIP imagery to map areas with recent evidence of Black-tailed Prairie Dog activity • Evaluate accuracy of this methodology through ground truthing of 1-hectare grid cells • Identify complexes for management and potential Black-footed Ferret reintroduction using 1.5 km rule • Provide summaries of colonies and complexes by various administrative units • Provide data products to partners for management actions, planning, ground truthing, and environmental reviews
Methods 1 • Use existing point and polygon data to create a Maxent predictive distribution model • Stratify a network of 717 20 km x 20 km grid tiles into high, medium, and low density areas • For each tile, blindly evaluate 1 hectare grid cells for evidence of recent prairie dog activity (code = 1) using 2005 NAIP color and IR, MaxEnt model, slope model, and black and white DOQQ imagery at scales between 1:5,000 and 1:30,000 (1:10:000 seemed to work best) • Turn on existing point, polygon, and flight data and evaluate against grid cells turned on • Revaluate areas without recent evidence recorded and if evidence is detected (code = 2) • Code anything that is possible, but less definitive as (code = 3)
Maxent Model Used to Develop Density Strata(Red = High, Green = Low, Blue = No Previous Documentation) * Grid Tiles are 20 km x 20 km
Code = 1 for 1 Hectare Grid Cells on each Tile with Evidence of Recent Prairie Dog Activity
Compare Grid Cell Coding Versus Points, Polygons, and Flight Lines at 20x20 km scale
Code = 2 for Grid Cells That Second Review shows Evidence of Recent Activity Slight Discrepancy with 2008 Flight Line Missed on Initial Pass
Problems with IdentifyingWhite-tailed Prairie Dog Colonies What are these white features?
Methods 2 • Stitch tiles together • Dissolve adjacent grid cells into colonies • Apply 750 meter buffer to identify 1.5 km complexes • Calculate total area colonies in complex • Code complexes by BLM Field Office, FWP Region, Tribal Reservation, Forest, and Stewardship • Evaluate complexes relative to Goals in Montana’s Conservation Plan
Potential Colony & 1.5 km Complex Summary Note: Acres have not been verified with ground truthing and are certainly an overestimate of on-the-ground acres due to the 1 Ha mapping unit used in this effort and likely misidentification of other features as colonies.
2009 NAIP 2005 NAIP 2008 Flight Intercept Point Observations
Colony Stewardship(Private = Gray, Federal = Yellow, State = Blue, Tribal = Brown)
Colony and Complex Consistency – South Rosebud County 2005 2009
Colony and Complex Consistency – North Rosebud County 2005 2009
Colony Size Class Distribution 2005 2009
Summary byFWP Region *Totals are greater than total number of colonies and total acreage because some colonies are split between FWP Regions.
Summary byBLM Field Office *Totals are greater than total number of colonies and total acreage because some colonies are split between B*LM Office.
Summary by County (2005 / 2009) *Some colonies are split between counties so sum of colonies and acreages here will exceed total no. & acreage of colonies.
Evaluation with Ground Truthing in 2010 1,143 one hectare grid cells were surveyed across 390 potential colonies
Definitions for Ground Truth Effort • ACTIVE: animals or fresh droppings at burrow entrances detected • INACTIVE: collapsed or open burrows detected, but no animals or fresh droppings at burrow entrances detected • NO EVIDENCE: no animals or any signs of collapsed or open burrows detected
Ground Truth Protocol 1. Navigate to potential colony 2. Navigate to each randomly selected 1-Ha grid cell 3a. Travel boundary of grid cell and then travel through interior if needed 3b. Travel to grid cell centroid and evaluate the area within a radius of 60-meters
Objective #3C – identify isolated prairie dog colonies in need of special consideration, assess their needs, and implement special management tasks, as appropriate Black = Pre-2010 Red = 2010
Suggested Uses and Future Work • Do not use acreage values from this assessment • Evidence of recent activity ≠ presence • NAIP not useful for White-tailed Prairie Dog colonies • Use with previous points and polygons when possible • Use polygonal layer of potential colonies in environmental reviews and broad scale planning, but note the need to evaluate individual polygons on the ground • Continue ground truthing unconfirmed colonies identified on 2005 or 2009 NAIP mapping - focus on isolated colonies • Focus more on landscape of documented use and management of those landscapes and less on outputs from single year evaluations