Download
1 / 75
750 likes | 756 Vues
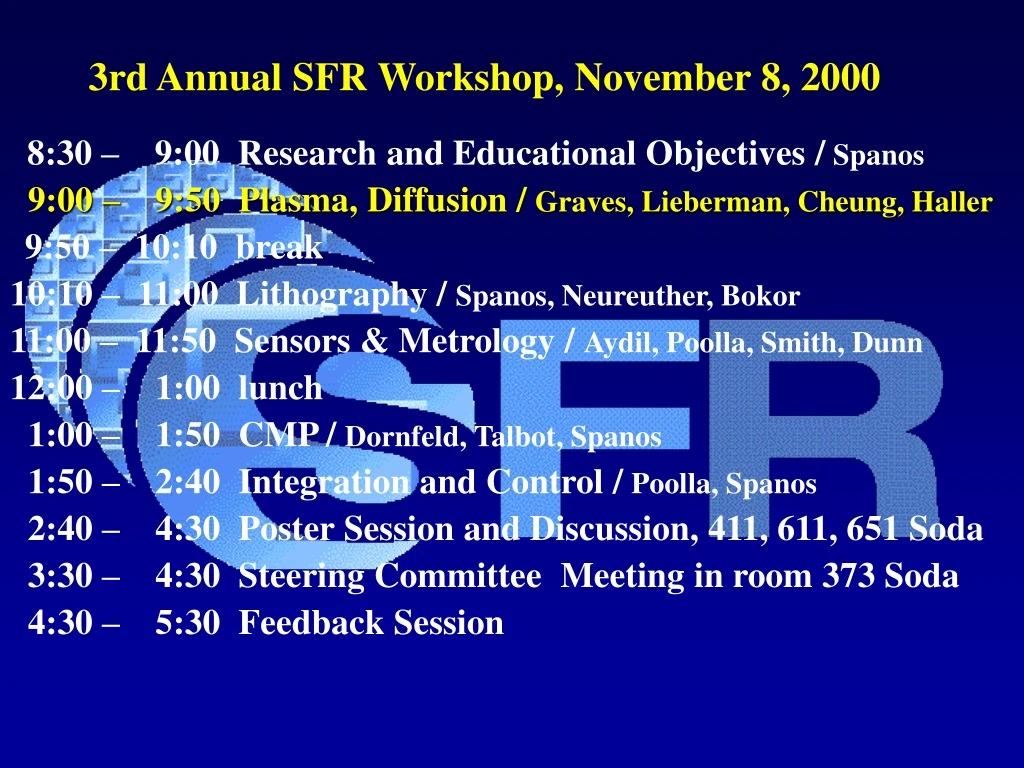
3rd Annual SFR Workshop, November 8, 2000. 8:30 – 9:00 Research and Educational Objectives / Spanos 9:00 – 9:50 Plasma, Diffusion / Graves, Lieberman, Cheung, Haller 9:50 – 10:10 break 10:10 – 11:00 Lithography / Spanos, Neureuther, Bokor

E N D
3rd Annual SFR Workshop, November 8, 2000 8:30 – 9:00 Research and Educational Objectives / Spanos 9:00 – 9:50 Plasma, Diffusion / Graves, Lieberman, Cheung, Haller 9:50 – 10:10 break 10:10 – 11:00 Lithography / Spanos, Neureuther, Bokor 11:00 – 11:50 Sensors & Metrology / Aydil, Poolla, Smith, Dunn 12:00 – 1:00 lunch 1:00 – 1:50 CMP / Dornfeld, Talbot, Spanos 1:50 – 2:40 Integration and Control / Poolla, Spanos 2:40 – 4:30 Poster Session and Discussion, 411, 611, 651 Soda 3:30 – 4:30 Steering Committee Meeting in room 373 Soda 4:30 – 5:30 Feedback Session
Plasma and Diffusion Studies UC SMART Major Program Award D. Graves, E. Haller, M. Lieberman, and N. Cheung SFR Workshop 11/8/00
Outline • Plasma-Surface Interactions and Modeling (Graves) • Diffusion in Isotopically Controlled Silicon (Haller) • Plasma Sources for SFR (Lieberman) • Plasma-Assisted Surface Modification: Low Temperature Bonding and Layer Transfer (Cheung)
Plasma-Surface Interactions and Plasma Modeling David Graves, Frank Greer, Dave Humbird, John Coburn, and Dave Fraser University of California Berkeley SFR Workshop November 8, 2000 Berkeley, CA
Radical Enhanced Atomic Layer Chemical Vapor Deposition (REALCVD) Frank Greer, John Coburn, David Fraser, David Graves SFR Workshop November 8, 2000
What is A.L.D.? • Atomic Layer Deposition • A.K.A. – Sequential Deposition, Digital Deposition, … • Usually a two step process • Chemisorption of a metallic precursor • Reactive ligand stripping by reactive stable molecule • Distinguishing feature Each step is self-limiting • Film thickness controlled by number of cycles S L S Y L M S S L L L S L S ~1 mL of M-Y ~1 mL of M-Lx
Likely A.L.D. Applications • High-k Gate Dielectrics • Highly uniform deposition • Atomic layer control of interface • Nitride Diffusion Barriers • Highly conformal deposition • Theoretically 100% step coverage
Barrier Layer Deposition by A.L.D. Key Issues: Barrier Properties Conductivity Conformality Thermal budget** Current barrier/seed films deposited via i-PVD challenged by high aspect ratios Nitride diffusion barrier Low k ILD
Radical Enhanced Atomic Layer CVD (REAL CVD)1 • Uses a volatile precursor and a radical source to deposit a film • Reactants introduced in separate steps to achieve atomic layer control • Products are nitride film and HCl • Radical flux instead of heated substrate catalyzes precursor decomposition • Potentially lower processing temperatures Step 1: TiCl4(g) Step 2: TiClx(ab) + XH*(g) + N*(g) TiN (s) + HCl(g) Precursor/Radical Inlet Wafer Heated (?) Pedestal 1A. Sherman U.S. Patent 1999.
Schematic of the Beam Apparatus in Cross-section (Top View) Quadrupole Mass Spectrometer (QMS) Future in-vacuo Auger Analysis X = O, N , D Atom Source Surface Reaction Products X Analysis Section Rotatable Carousel Chopper Ion Source + + Load Lock • Experimental Diagnostics • QCM • - Measures mass • change of film • QMS • - Measures products • formed on film • - Characterize beams Silicon-coated Quartz Crystal Microbalance (QCM) TiCl4 Main Chamber Precursor Doser
Experimental Procedure 1. Adsorption • Conventional ALD-like sequence • Each step in process monitored in-situ with QCM • Cycle used multiple times to grow a film • Surface temp varied (32, 80, 135 oC) 2. Pump down TiCl4 3. Dechlorination 4. Pump down 5. Nitridation D ~1 mL of TiClx N ~1 mL of Ti-Dx ~1 mL of Ti-Nx
Precursor Adsorption QCM Results Uptake Upon Exposure to TiCl4 • Two distinct uptake regimes • Initial rapid ads. followed by significantly slower ads. • Adsorption may not be confined to a single monolayer • Data fairly well represented by assuming precursor adsorbs two monolayers of TiCl2* • Model fit allows estimation of: • Sticking probabilities • Active site (*) densities TiCl4 Adsorption TiCl2 Molecules/cm2 TiCl4 Exposure (L) 1 L = 1015 Molecules * TiClx * * Suntola, T. et al. 1996
Temperature (oC) s(TiN) initial sticking s(TiClx) self sticking Site Density (#/cm2) 32 8x10⁻³ 1x10⁻⁴ 5x10¹⁴ 80 8x10⁻³ 9x10⁻⁵ 5x10¹⁴ 135 8x10⁻³ 6x10⁻⁵ 5x10¹⁴ Adsorption Model Results • initial sticking ~ 100x self sticking • contributes to uniformity • self sticking decreases with inc. T • coverage is more monolayer-like at higher temperatures TiCl4
Dechlorination Results • Exponential decay in Cl/cm2 fit assuming replacement of Cl with D • kD+ClDCl = 3x10⁻⁴ • Fairly insensitive to T • Calculated removed Cl density within a few% of ads. assumptions • Suggests TiCl2 is appropriate surface species D Dechlorination Cl QCM Cl Lost Upon Exposure to Deuterium • Cl loss due to abstraction by D atoms • ex-situ XPS analysis shows ave. Cl conc. = 2.2% (0.6%-3.8%)* Cl Atoms/cm2 * Process not optimized for chlorine removal D atom Exposure (L)
Nitrogenation Results N • Nitrogen uptake does not saturate! • ex-situ XPS shows N/Ti > 3 • Initial uptake of nitrogen fit to linear model • sN = 8x10⁻³ • fairly insensitive to T • uptake slows over time suggesting diffusional limitations into the film Nitrogenation D QCM Uptake Upon Exposure to N atoms N Atoms/cm2 Nitrogen Atom Exposure (L)
Summary and Implications Summary of Results • Cl content of films • TiCl4 overexposure • Insufficient D exposure • 1. TiCl4 has two adsorption regimes at these temperatures: • Initial rapid uptake • (s1=8x10⁻³) • Slower continuing uptake • (s2~8x10⁻⁵) • Change likely coincides with 1st monolayer coverage • D atoms remove Cl from surface: • g = 3 x10⁻⁴ • ex-situ XPS shows not all Cl removed from surface
Summary and Implications • Low rxn. probabilities for all species • Correct comparison for processing is rate of transport of radicals to feature bottom with rate of reaction on feature sides • Transport rate > Reaction rate for aspect ratio ~ 5 • uniform rxn. rates throughout features • As aspect ratio increases, transport rate will slow • could lead to non-uniform deposition Summary of Results • 3. N atoms react with surface • Initial Reaction Probability: • s = 8x10⁻³ • Rate slows over time, but does not stop • Likely becomes diffusion limited N H
Milestones • 2001 • Design and test precursor doser, conduct preliminary film deposition studies • Test self-limiting film formation kinetics • 2002 • study effects of surface type, preparation and temperature on film properties • measure radical-surface kinetics • 2003 • apply method for patterned barrier film application • Explore DRAM capacitor applications
Damage Profiles of Low-Energy Ion Bombardment:Application to Ion Milling Dave Humbird, David Graves SFR Workshop November 8, 2000 Berkeley, CA
Motivation • Theory suggests that ion energy deposition is closely related to surface roughening and rippling: possible LER impact • MD studies show energy deposited by low-energy (eg. 200 eV) ion impact is localized to a very narrow region near the surface • Motivates question: how small a feature can be etched or milled by very tightly focused ion beam?
initial configuration Molecular Dynamics (MD) Simulation Interatomic Potential Interatomic Forces typical MD time step: update positions evaluate forces • Simulation is non-equilibrium! • Kinetic + potential energy is always conserved update velocities
Ion-Induced Displacement Simulations • Simulation cell size is 20 x 20 x 20 ų (512 atoms) • Introduce energetic Ar with velocity normal to surface • Follow motion of all Si atoms until collision cascade subsides • Repeat x 2000 for statistics • Formulate a distribution (in r and z, relative to the point of impact) of atoms’ displacements 1 Expense: 100 impacts = 40 min (PIII-700) 1 in the spirit of Winterbon, Sigmund, and Sanders, Mat. Fys. Medd. Dan. Vid. Selsk. 37 (14) (1970)
Ion Energy Deposition (Displacement) Profile • Si atoms are displaced from their origins by a distance proportional to the color temperature. (red → ~6 Å, blue → 0 Å) Atomic Displacement Distribution 200 eV Ar Impacts, Normal Incidence Relative coordinate system: 20Å ion trajectory
Ion “Milling” Simulation • Simulation cell is substantially larger (60 x 60 x 40 ų, 9200 atoms) • Introduce energetic Ar ion above surface, confined to a “beam” of radius 12 Å about the center • Follow collision cascade • Delete sputtered Si atoms • Cool cell to room temperature • Accumulate impacts on the same cell Expense: 100 impacts = 20 hours (PIII-700)
Feature Evolution Representations of the surface after 330 impacts (200 eV Ar, normal incidence) Stereograph top view Tissue-paper plot • side view, +y direction 25 Å
Milestones 2001 Milestone Write and test MD code to study energy deposition profiles. Conduct preliminary sputtering studies. Compare to phenomenological theory. 2002 Milestone Write and test code to study ion-induced surface diffusion. Compare results to phenomenological theory and experiment. 2003 Milestone Simulate energy deposition and surface diffusion andcompare to LER experiments.
Diffusion in Isotopically Controlled Silicon Eugene E. Haller University of California at Berkeley and Lawrence Berkeley National Laboratory SFR-UCB SMART, November 8, 2000
Collaborators • C. B. Nelson, GSRA in MSE Dept., UCB • Dr. H. Bracht, Univ. of Münster, Germany • Dr. S. Burden, ISONICS Corp., Golden, CO
Diffusion, Native Defects and Impurities – Major experimental observation: Substitutional impurities diffuse assisted by native defects – The major native defects are vacancies and self-interstitials in monatomic crystals – Many native defects exist in more than one charge state: Fermi level effects
interstitialcy- vacancy - Exchange (ring) mechanism I V Dopant and Self-Diffusion in Crystalline Solids
Self-Diffusion in Crystalline Solids • Self-diffusion studied with radioactive isotopes: • often limited by low activity and short half-life of the radiotracer (e.g. T1/2 of 31Si is 2.6 hrs) • deposition alters the near-surface crystal quality of the material under study • special safety requirements • Self-diffusion studied with stable isotopes: • at least two stable isotopes must exist (28Si, 29Si, 30Si) • growth of epitaxial layers by VPE or MBE • self-diffusion can be observed at several buried interfaces
The Isotope Superlattice Isotope Heterostructures
1022 1021 1020 29Si Concentration (cm-3) 1019 30Si 1018 1017 0 1 2 3 4 5 6 Depth (micron) Undoped Silicon Isotope Heterostructure
Profiles: as-grown H. Bracht, E. E. Haller, and R. Clark-Phelps, Phys. Rev. Lett 81 (1998) 393 Self-Diffusion in Pure Silicon
Self-Diffusion in Pure Silicon Temperature dependence: H. Bracht, E. E. Haller, and R. Clark-Phelps, Phys. Rev. Lett 81 (1998) 393
Transport coefficients: Results: • I-related data consistent with theoretical results • reliable data for V are still lacking (controversy: low T « high T) Thermodynamic Properties
• Boron diffusion mechanism • Considering charge states: and Boron and Si Self-Diffusion
Boron and Si Self-Diffusion • Boron and Si self-diffusion are coupled via the Si interstitial population • System of four coupled differential equations has to be solved numerically kf,b = forward/backward rate constants
• Modification of the Si self-diffusion coefficient through the presence of B • Extraction of as function of the temperature and EF • Determination of donor level position of I0/+ • In case CI ~ Cboron, compensation of boron acceptors will accrue, allowing the determination of CI Boron and Si Self-Diffusion
Conclusions and Outlook • Boron doped Si isotope heterostructures hold promise for the first determination of the interstitial transport coefficient CIVI as a function of EF and temperature. • In case CI ~ CB , we can determine CI • Accurate knowledge of CIVI is crucial for modeling B diffusion • Analogous experiments will be conducted with P. High P concentrations will induce the formation of vacancies
Plasma Sources for Small Feature Reproducibility SFR Workshop November 8, 2000 Berkeley, CA M. A. Lieberman, A. J. Lichtenberg, A. M. Marakhtanov, K. Takechi, and P. Chabert Berkeley, CA
Milestones • September 30, 2001 - Etch resist in LAPS to examine uniformity. - Characterize instability using OES/actinometry and planar probe. - Install the Z-scan sensor and explore the spectral RF signature of plasma instabilities. • September 30, 2002 - Characterize plasma instability using V-I-phase probe. - Model for reduced electron temperature and density. • September 30, 2003 - Develop and test instabilities control. Reduce electron temperature and density in discharges.
Experimental LAPS Setup Antenna coil embedded in the plasma Eight quartz tubes threaded by copper antenna tubes 36.0 cm x 46.5 cm processing area Plasma Voltage sensor Rs Xm(0.5uH) D X1 900 pF (fixed) 12- 1000 pF New series-parallel system configuration Vrf C Bm1 B Bm2 X2 12- 500 pF A
Oxygen Discharge Model Substrate holder metal (Center of the chamber) (cm) 5 Side metal Calculation area B.C. Vn=0 ….. r1 r2 r8 -5 R -15 15 (cm) Quartz Chamber geometry used in the model Particle balance : Power balance :
Ion flux profiles at substrate surface for various gas pressures (simulation results)
Photoresist Etch Model E.R. : Etch rate ji : Ion current density at substrate surface pO : O-atom pressure at substrate surface kref : Ion-induced desorption rate constant at Vbias= 0 V Plots of etch rate vs. pressure for various rf powers. The fits are from the above equation with simulation results.
Effect of applying a substrate bias on etch rate and uniformity Applying a Vbias leads to increase in both etch rate and uniformity over the processing area. Etch rate profiles at a gas pressure of 5 mTorr at Vbias= 0 V and Vbias= -80 V
Experimental TCP Setup Planar Probe Monochromator Plasma Inductive Coil 30 cm 19 cm OES (PMT) Langmuir Probe Mass Spectrometer