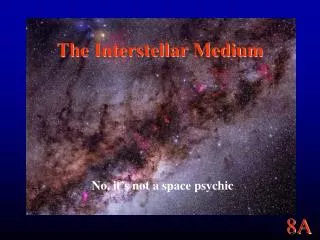
Mapping the Interstellar Medium
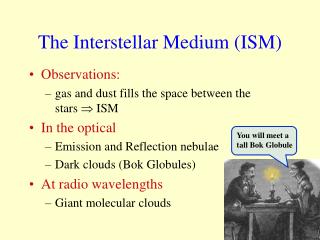
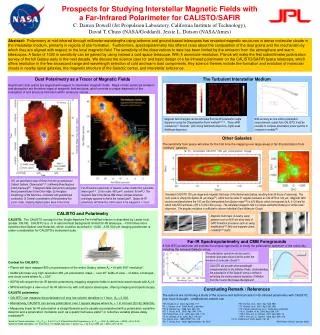
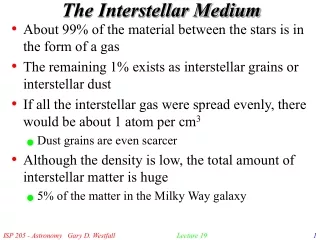
Mapping the Interstellar Medium. Alyssa A. Goodman Harvard-Smithsonian Center for Astrophysics (on sabbatical 2001-2 at Yale University) cfa-www.harvard.edu/~agoodman. Barnard’s Interstellar Medium. Counts of stars per unit area measure how much material must be producing obscuration.

Mapping the Interstellar Medium
E N D
Presentation Transcript
Mapping the Interstellar Medium Alyssa A. Goodman Harvard-Smithsonian Center for Astrophysics (on sabbatical 2001-2 at Yale University) cfa-www.harvard.edu/~agoodman
Counts of stars per unit area measure how much material must be producing obscuration. “Barnard’s Method”: Star Counting Observations by Alves, Lada & Lada 1999
HST, IRAS (Earth Orbit) SIRTF (Sun Orbit) Telescopes Used in Our Mapping of the ISM Nagoya 4-m (Japan) FCRAO & CfA (Mass.) IRAM 30-m (Spain) JCMT (Hawaii) Arecibo (Puerto Rico) KPNO 12-m & HHT (Arizona) NTT, VLT (Chile) ATCA+Parkes (Australia)
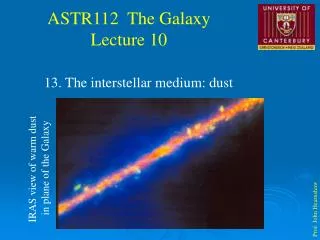
The “Modern” ISM Barnard’s Optical Photograph of Ophiuchus IRAS Satellite Observation, 1983 Remember: Cold (10K) dust glows, like a blackbody, in the far-infrared.
Tutorial: Absorption, Scattering, Emission & Extinction Absorber “Absorption” Scatterer “Scattering” Emitter “Emission” Note: Absorption + Scattering = “Extinction”
Advanced Tutorial: “Wavelength Dependence of Extinction” Light is “Extinguished” & Does not Reach Us “Dust Grain” Light Goes Right by & Reaches Us “Dust Grain”
Optical Seeing “through” the Clouds Near-Infrared
Star Formation (a.k.a. GMC or Cloud Complex)
Magnetohydrodynamic Waves Inward Motions Outflows MHD Turbulence Thermal Motions Star Formationin the ISM SNe/GRB H II Regions
The “Modern” ISM Barnard’s Optical Photograph of Ophiuchus IRAS Satellite Observation, 1983 Remember: Cold (10K) dust glows, like a blackbody, in the far-infrared.
Motte, André & Neri 1998 The Very Cold ISM: 850 mm Emission (T~15K)
The “Modern” ISM Contours show Molecular Line (CO) Map M. Pound 1998
Velocity Galactic Longitude What NASA Didn’t Explain…but I will… “Molecular Hydrogen” (is really a CO map) Galactic Latitude Galactic Longitude Spectral Lines Give VELOCITY
Molecular Clouds: The Stuff of New Stars The Oschin telescope, 48-inch aperture wide-field Schmidt camera at Palomar Red Plate, Digitized Palomar Observatory Sky Survey
Tutorial:Velocity from Spectroscopy Observed Spectrum Telescope Spectrometer 1.5 1.0 Intensity 0.5 0.0 -0.5 All thanks toDoppler 100 150 200 250 300 350 400 "Velocity"
Tutorial:Velocity from Spectroscopy Observed Spectrum Telescope Spectrometer 1.5 1.0 Intensity 0.5 0.0 -0.5 All thanks toDoppler 100 150 200 250 300 350 400 "Velocity"
Radio Spectral-line Observations of Interstellar Clouds Radio Spectral-Line Survey Alves, Lada & Lada 1999
Velocity as a "Fourth" Dimension Loss of 1 dimension No loss of information
Giant Outflow from a Young Star (PV Ceph) Goodman & Arce 2002
"Cores" and Outflows 1 pc = 3 lyr Molecular or Dark Clouds Jets and Disks Solar System Formation Rotation, Outflow & Turbulence all rely on Velocity Measurements
1950 1960 1970 1980 1990 2000 8 10 4 10 7 10 N 6 channels, 10 channels 3 10 *N N 5 10 channels pixels S/N in 1 hour, 2 10 4 10 (S/N)*N N 3 10 1 N 10 pixels pixels 2 10 0 10 1950 1960 1970 1980 1990 2000 Year Molecular Spectral Line Mapping Product That’s a one-thousand-fold “improvement” in 20 years. S/N
Real & Simulated Spectral Line Maps Based on work of Padoan, Nordlund, Juvela, et al. simulation shown used in Padoan & Goodman 2002.
[ ] T / 10 K b = [ ] 2 -3 [ ] n B m / 100 cm / 1 . 4 G H 2 The Value of MHD Simulations b=0.01 b=1 • Driven Turbulence; M K; no gravity • Colors: log density • Computational volume: 2563 • Dark blue lines: B-field • Red : isosurface of passive contaminant after saturation Stone, Gammie & Ostriker 1999
“Equipartition” Models “Stochastic” Models How Well do Numerical Models Match Reality? “Reality” Power-Law Slope of SCF vs. Lag Scaled “Superalfvenic” Models Padoan & Goodman 2002 Magnitude of Spectral Correlation at 1 pc
Galactic Scale Heights from the SCF (v.2.0) HI map of the LMC from ATCA & Parkes Multi-Beam, courtesy Stavely-Smith, Kim, et al. Padoan, Kim, Goodman & Stavely-Smith 2001
Mapping Everything? (a.k.a. GMC or Cloud Complex)
The SIRTF Legacy Survey SIRTF’s1st Plan forStar-FormingRegions “From Molecular Cores to Planet-Forming Disks” Neal J. Evans, II, Principal Investigator (U. Texas) Lori E. Allen (CfA) Geoffrey A. Blake (Caltech) Paul M. Harvey (U. Texas) David W. Koerner (U. Pennsylvania) Lee G. Mundy (Maryland) Philip C. Myers (CfA) Deborah L. Padgett (SIRTF Science Center) Anneila I. Sargent (Caltech) Karl Stapelfeldt (JPL) Ewine F. van Dishoeck (Leiden)
SIRTF Legacy Survey Perseus Molecular Cloud Complex (one of 5 similar regions to be fully mapped in far-IR by SIRTF Legacy)
2 degrees ~ 10 pc SIRTF Legacy Survey MIRAC Coverage
The COordinated Molecular Probe Line Extinction Thermal Emission Survey Our Plan for theFuture:COMPLETE Alyssa A. Goodman, Principal Investigator (CfA) João Alves (ESA, Germany) Héctor Arce (Caltech) Paola Caselli (Arcetri, Italy) James DiFrancesco (Berkeley) Doug Johnstone (HIA, Canada) Scott Schnee (CfA) Mario Tafalla (OAS, Spain) Tom Wilson (MPIfR/SMTO)
Molecular Line Map 2MASS/NICER Extinction Map of Orion Johnstone et al. 2001 Johnstone et al. 2001 Nagahama et al. 1998 13CO (1-0) Survey Un(coordinated) Molecular-Probe Line, Extinction and Thermal Emission Observations Lombardi & Alves 2001
Optical Image C18O Dust Emission Radial Density Profile, with Critical Bonnor-Ebert Sphere Fit NICER Extinction Map The Value of Coordination Coordinated Molecular-Probe Line, Extinction & Thermal Emission Observations of Barnard 68 This figure highlights the work of Senior Collaborator João Alves and his collaborators. The top left panel shows a deep VLT image (Alves, Lada & Lada 2001). The middle top panel shows the 850 m continuum emission (Visser, Richer & Chandler 2001) from the dust causing the extinction seen optically. The top right panel highlights the extreme depletion seen at high extinctions in C18O emission (Lada et al. 2001). The inset on the bottom right panel shows the extinction map derived from applying the NICER method applied to NTT near-infrared observations of the most extinguished portion of B68. The graph in the bottom right panel shows the incredible radial-density profile derived from the NICER extinction map (Alves, Lada & Lada 2001). Notice that the fit to this profile shows the inner portion of B68 to be essentially a perfect critical Bonner-Ebert sphere
Is this Really Possible Now? 1 day for a 13CO map then 1 minute for a 13CO map now
5 degrees (~tens of pc) SIRTF Legacy Coverage of Perseus COMPLETE, Part 1 Observations: Mid- and Far-IR SIRTF Legacy Observations: dust temperature and column density maps ~5 degrees mapped with ~15" resolution (at 70 m) NICER/2MASS Extinction Mapping: dust column density maps, used as target list in HHT & FCRAO observations + reddening information ~5 degrees mapped with ~5' resolution HHT Observations: dust column density maps, finds all "cold" source ~20" resolution on all AV>2” FCRAO/SEQUOIA 13CO and 13CO Observations: gas temperature, density and velocity information ~40" resolution on all AV>1 Science: Combined Thermal Emission (SIRTF/HHT) data: dust spectral-energy distributions, giving emissivity, Tdust and Ndust Extinction/Thermal Emission inter-comparison: unprecedented constraints on dust properties and cloud distances, in addition to high-dynamic range Ndust map Spectral-line/Ndust Comparisons Systematic censes of inflow, outflow & turbulent motions will be enabled—for regions with independent constraints on their density. CO maps in conjunction with SIRTF point sources will comprise YSOoutflow census
FCRAO N2H+ map with CS spectra superimposed. COMPLETE, Part 2 (Lee, Myers & Tafalla 2001). Observations, using target list generated from Part 1: NICER/8-m/IR camera Observations: best density profiles for dust associated with "cores". ~10" resolution SCUBA Observations: density and temperature profiles for dust associated with "cores" ~10" resolution FCRAO+ IRAM N2H+ Observations: gas temperature, density and velocity information for "cores”~15" resolution Science: Multiplicity/fragmentation studies Detailed modeling of pressure structure on <0.3 pc scales Searches for the "loss" of turbulent energy (coherence)
Mapping the Interstellar Medium Alyssa A. Goodman Harvard-Smithsonian Center for Astrophysics (on sabbatical 2001-2 at Yale University) cfa-www.harvard.edu/~agoodman