Download
1 / 45
450 likes | 620 Vues
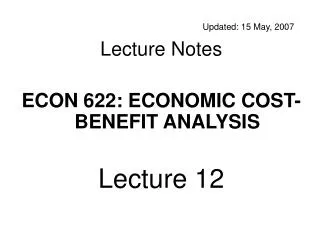
Updated: 15 May, 2007 Lecture Notes ECON 622: ECONOMIC COST-BENEFIT ANALYSIS Lecture 12. Evaluation of Investments in Education. Economic Evaluation of Education Projects. Educational projects may have many types of components, with benefits measurable in both monetary and nonmonetary terms

E N D
Updated: 15 May, 2007 Lecture Notes ECON 622: ECONOMIC COST-BENEFIT ANALYSIS Lecture 12
Economic Evaluation of Education Projects • Educational projects may have many types of components, with benefits measurable in both monetary and nonmonetary terms • Investment in education generates various in-school and out-of-school benefits. • In-school benefits include gains in the efficiency of the education system. • Out-of-school benefits include improvement of the income-earning skills of the students and externalities- benefits that accrue to society at large beyond the project beneficiaries.
Evaluating Investments with In-School Benefits • In-school benefits include gains in the efficiency of the education system. • As in any other enterprise, the production of education services involves decisions how it combines inputs. • Some choices are more efficient than others, we can quantify the benefits of investments in education according to the extent they support efficient choices.
Example 1: In-School Benefits • Consider a project involving the consolidation of small primary schools in a region with approximately 15 pupils per teacher compared with country’s national average of 30. • The unit cost of education in the small schools is thus about twice the national average. • As a result of the project the pupil-teacher ratio rises to 20 on average, unit costs would have been reduced by 25 percent. • The reduction in unit costs counts as a project benefit and can be compared with the cost of school consolidation to evaluate its economic viability.
Example 2: In-School Benefits • Investments to improve the quality of teaching and school conditions often enhance learning and reduce students’ need to repeat. • In economic evaluation of the project, the analyst compares the costs of these investments to the expected savings from lower repetition rates. • A project that reduces repetition rates will produce savings in recurrent costs. • If unit costs average 100 US$ per student, and repetition in a student population of 200,000 drops from an average rate of 15 % to 10 % as a result of the project, the savings in cost would amount to a total (ANNUALY):
Evaluating Investments with Out-of-School Benefits • Out-of school benefits arise after the project’s beneficiaries finish a course of study or leave a training program. • The most obvious of such benefits is the gain in the beneficiaries’ work productivity, as reflected in differences in pay or in farm output. • The difference in outputs between the two groups of farmers, valued in market prices, can be used to estimate the economic benefits of investing in primary education. • In evaluating a project from society’s point of view, all the benefits interest us: before tax earnings, and the value of fringe benefits in the wage package, such as value of health insurance and retirement benefits.
The calculation typically involves two steps: 1) estimating the relevant age earnings profiles to obtain the increment in earnings at each age2) discounting the stream of incremental earnings to the time of graduation using an appropriate discount rate. Figure 1. Age-Earnings Profiles of High School and University Graduates in Venezuela, 1989 300,000 250,000 University Graduates 200,000 150,000 100,000 High School Graduates 50,000 12 16 20 24 28 32 36 40 44 48 52 56 60 Source: Pedro Belli (2001) Age
Evaluating Investments with Out-of-School Benefits (Cont’d) • We could also estimate a regression equation for workers within each education group, relating each person’s earnings Y to his or her age A, as follows: Once the function has been estimated, we can substitute different values for age into the equation to obtain the desired age-function profiles
Incorporating the Value of Externalities • Most of the social benefits associated with education have not been quantified. • Study of Haveman and Wolfe 1984 lists 20 types of benefits associated with education, including crime reduction, social cohesion, technological change, income distribution, charitable giving, possibly fertility reduction etc. • Thus, given the current state of knowledge in the field, it may prove difficult to incorporate these benefits in project evaluation.
If the returns to university education interest us, the profiles would refer to earnings for university and high school graduates Age earnings profile of university graduates Benefits Earning/Cost Age earnings profile of school graduates secondary Forgone Earnings 18 65 22 Age Direct Costs 47 0 4 Time (Years) Source: Pedro Belli (2001)
The standard formula in Cost-benefit analysis can be modified to the specific problem here: , • refer to the earnings of secondary • and university graduates - refers to annual unit cost of university education - refers to the discount rate - refers to the time periods
Returns to Investment in Education by Level, Latest Available Year (Percent)
Returns to education by Gender (Percent) Source: George Psacharopoulos and Harry Anthony Patrinos (2002)
Application of Cost-Effectiveness Analysis to Investment Selection in School Infrastructure • Two main processes in capital appraisal for school buildings: • selection of schools for construction of new classrooms; • allocation of funds between the construction of new class-blocks and rehabilitation of the existing facilities.
Background • Limpopo is characterized by shortages of class-rooms. • At present, the class-room backlog stands at around 13,000 if a classroom were available for every 40 pupils. • Many schools, especially in rural areas, lack basic utilities such as electricity, telecommunications, water and sanitation. • Great effort undertaken since 1997: 7,000 class-rooms were built between 1995-2001, and additional 800 class-rooms in 2002. • At the current rates, it will take about 10-15 years to overcome the backlogs. • To remedy situation, the infrastructure spending has been increased by more than 100% over 2002/03. • Setting priorities for maintenance is also a major concern.
The Problems • In a situation when there are so many requiring additional infrastructure, the selection task is to have a system of priorities to guide the budget allocation for construction of new class-blocks. • The allocation of rehabilitation budget requires a system of priorities that would incorporate the cost of repair and the priority of school in terms of the need for additional infrastructure.
Approach • A weighted cost-effectiveness (cost-utility) analysis can be employed for capital project selection at Department of Education. • The task is to maximize the overall effectiveness of public expenditure on school infrastructure within a given amount of budget. • The effectiveness is to be measured by a “priority index” (PI) which includes a weighted total of all the important factors affecting the project selection.
Priority Index in Capital Project Selection • The effectiveness is measured by a “priority index” (PI) which can is constructed to include all important factors affecting the project selection.
Infrastructure Adequacy • There are two aspects of infrastructure adequacy: class-block backlog and the learner-to-classroom ratio. • (A) Class-block Backlog. The class-room backlog is estimated as the number of additional buildings, measured by a standard 4-class block, required at a particular school in order to maintain the maximum acceptable class size. Weight in PI Index = 0.70. • (B) Learner-to-Classroom / Target Class Size Ratio. The overcrowding of classes is measured by the excess of actual class attendance to the maximum target class size, i.e. by the learner-to-classroom / target class size ratio. Weight in PI Index = 0.30.
Example • A mixed sample of both primary and secondary schools in urban and rural areas. All 8 school areas have infrastructure backlogs. • Different sizes of schools, and different number of classrooms are currently available. • The availability of basic facilities varies from location to location. • Question: How to rank these schools in terms of their priority for additional infrastructure?
Infrastructure Unit • The construction of class-blocks is standardized by the regulations. • In 2003/04, the cost of construction of one standard 4 class-room block is R 420,000. • The Department of Education make selection of where to construct the schools and places a request to the Department of Public Works to carry out the construction of new class-blocks. • The selection of constructor, management and quality control is all facilitated by the Department of Public Works. • If construction teams of Public Works are available, the construction is carried out internally. If teams are not available, then Public Works will put the class-blocks on tender for a private contractor.
Efficiency Maximization Rule • RULE: Because the priority index reflects a number of objectives, the overall effectiveness of budget spending is maximized when the funds are used to build schools in the area with the highest ranking. • The issue is how to decide which school areas should be given the funding and for how many school-blocks.
Budget Allocation • The approach is to allocate each additional class-block to the school area ranking first in terms of the priority index. • Because each additional building will alter the current priority index and ranking of schools, the ranking is recalculated after each new addition of class-rooms or support facilities, or changes in the type of school or in the development priority factors. • It is a multi-stage selection process. • Note that during each round only one additional class-block is being awarded to the school area that has the highest ranking.
Allocation Results • Hence, the allocation rule has allocated the limited budget funds in the most efficient manner. • This system of prioritarization is such that will ensure that the benefits are maximized from the allocation of capital budget for the construction of new class-blocks. • Notes: * Ranked first before allocation. ** Ranked second before allocation. *** Ranked third before allocation.
Priority Index in Rehabilitation of Existing Buildings • A number of damaged class-rooms exist in the selected 8 school areas. • The physical condition of these structures and estimated rehabilitation costs differ. • Question: Where rehabilitation funds should be funneled to achieve the highest effectiveness? • Answer: To achieve the maximum effectiveness of spending, class-rooms that are cheapest to repair in school areas with the highest priority index (i.e. need for additional infrastructure) should be selected for repair.
Relative Rehabilitation Cost • It is assumed that a building in category “1” condition will only stand one more year. A building in category “2” will stand, on the average, 4 more years, before it becomes completely useless. Rehabilitation Cost Relative Rehabilitation Cost = ----------------------------------------------- PV of new Class-room Replacement • PV of new replacement cost of a class-room: • in 1 year is estimated as R2004 94,600 = (R 105,000 / [(1+11.0%)1]); • PV of new replacement if needed in 4 years is R2004 69,200 (R 105,000 / [(1 + 11.0%)4]), both expressed in 2004 prices.
Priority Index in Rehabilitation of Existing Buildings • Rehabilitation decisions involve comparing inter-temporal situations, and the relevant priority index should be first computed for all school areas without one class-room, and then should be discounted back to the base year (2004). • Let’s look at the priority of the school areas in terms of the current infrastructure adequacy and other important factors. • In a situation when two school areas have the same rehabilitation costs, the one with a higher priority index (PI) should be selected first because it is in more need than the other. • Since, the priority index for all school areas has been estimated; we can use this index for rehabilitation decisions. • However, the priority index computed for ranking the construction of new class-blocks does not include the condition of the class-rooms.
Priority Index without One Class-room • Let’s remove one class-room from each school area in order to see what its priority index would be if one class-room becomes completely unsuitable, i.e. a class-room collapses of natural causes such as damage, flood, soil settlement, etc. • The priority index of each school area will increase because the same population of learners will have to share a smaller infrastructure territory. • It is assumed that all other factors, summarized by the augmenting adjustment, remain constant. • For example, school area 3 currently has 6 class-rooms and a learner-to-classroom ratio of 92, and if one of its structures collapses then the ratio will rise to 110, which will also entail a change in its priority index.
PV of Future Priority Index without One Class-room • Our priority system is concerned with the buildings in condition “1” and “2”, implying a horizon of 1 year and 4 years, respectively. • This means that future school area priority index without a class-room should be discounted by 1 year and 4 years. • The relevant discount rate is the economic opportunity cost of capital (EOCK) for South Africa, estimated as 11.0%. • Thus, if school area 1 suffers loss of one class-room in a year time, the present time equivalent of a 3.25 priority index would be only 2.93: 3.25 / ([1 + 11.0%]1) = 2.93 • The present-day equivalent of the school priority index in a situation when one classroom of the same school area becomes unusable after 4 years is, therefore, 2.14: 3.25 / ([1 + 11.0%]4) = 2.14
Discounted Future School Priority Index if a Classroom becomes Unsuitable for Education
Rehabilitation Priority Index • If the necessary repair works cost more than the construction of a new class-room in the future, then the relative rehabilitation cost is more than unity, and as a result, the rehabilitation priority index become lower. • However, if the repairs are cheaper than the replacement of this structure in the future, then the relative rehabilitation cost is below unity, and the class-room’s rehabilitation priority index is enlarged. • The index matches the costs of rehabilitation and the need of the school for additional infrastructure.
Budget Allocation Rule • The top positions of the rehabilitation ranking are occupied by class-rooms that are both relatively cheaper to repair and being located in schools with the highest need for additional infrastructure. • The allocation rule is to start funding the schools at the top of the rehabilitation ranking ladder and then to continue spending as long as the budget size allows.
Assume that the total rehabilitation budget available for the current year is R 300,000 and the schools having damaged class-rooms are limited to the eight school areas in our example. • Then, the allocation rule would spend the funds in the order of the rehabilitation ranking up to a point when the budget is exhausted.
Allocation Results • With a fixed budget of R 300,000, district school 8 should be financed to have its class-room 8.B to be rehabilitated at cost of R 45,000. • Then, School 4 will have three of its class-rooms (4.B, 4.E and 4.F) repaired at a total cost of R 220,000. • Finally school 3 should be given funding for repair of class-room 3.A with a cost of R 35,000. • This combination exhausts the budget available and maximizes the efficiency of rehabilitation spending.
Concluding Remarks • An application of the proposed priority index for the capital project selection of the new class-blocks and for the rehabilitation decisions concerning the existing buildings has been carried out on a sample of 40 provincial schools. • The data and parameters of the selected schools were taken directly from the EMIS system. • A reliable MIS system is crucial for functioning of capital selection. • The data requirements for the estimation of the indices are very modest. • The existing management information system can be employed to supply the data for estimation of the priority indices.