Download
1 / 54
540 likes | 608 Vues
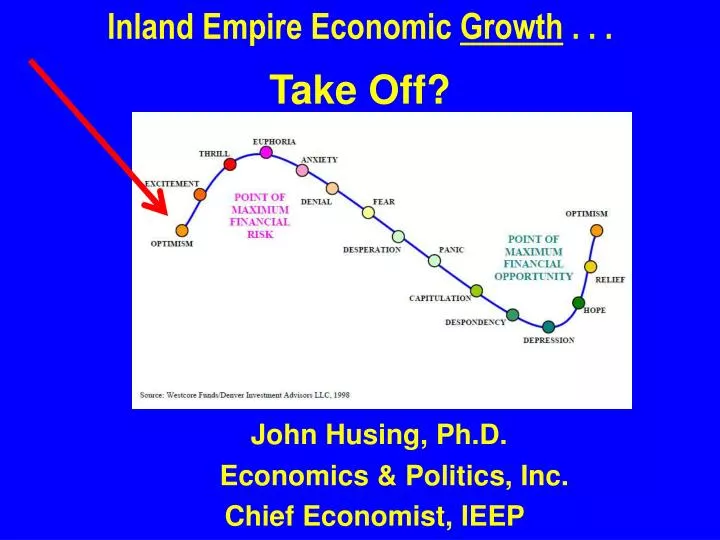
Inland Empire Economic Growth . . . Take Off?. John Husing, Ph.D. Economics & Politics, Inc. Chief Economist, IEEP. After Losing 8.78 Million Jobs … U.S. Jobs Are Still Crawling Back. -664,000 Government Jobs +8,221,000 Private Sector (94.1%).

E N D
Inland Empire Economic Growth . . . Take Off? John Husing, Ph.D. Economics & Politics, Inc. Chief Economist, IEEP
After Losing 8.78 Million Jobs …U.S. Jobs Are Still Crawling Back -664,000 Government Jobs +8,221,000 Private Sector (94.1%)
How Regional Economies Work Secondary Tier Economic Development … Increase The Economic Base! Primary Tier
Three Step Growth ProcessBased On Interaction Of: • Population • Preferences • Dirt Prices Force Decisions
As a homeowner, would you prefer to move closer to work if it involved a townhouse or condo?(I-15 & Sr-91 Commuters, 2008) 87.5% No Answer stable over 5 years Same question to Renters: 72.3% No
Stage #1: Rapid Population Growth • People forced to move inland for affordable homes • Population Serving Jobs Only • High Desert & I-215 South are current examples
Share of Underwater Homes Plunging 4Q 2012 to 3Q 2013 333,720 to 170,768 -48.8%
Home Price Trends 32.3% 49.5% less for Existing home 52.8% -39.2%
Undeveloped Land … Industrial Prices Much Lower In Outlying Areas Exhibit 13.-Industrial Space Costs Differences Southern California, Sub-Markets, March 2013 Price Per Sq. Ft. 156.6% Price with 20% Cubic Factor Difference . $0.78 107.2% % Difference $0.63 $0.56 84.2% $0.38 $0.30 Inland Empire Los Angeles Co. Orange Co. San Diego (non-R&D) nnn=net of taxes, insurance, common area fees Source: CB Richard Ellis
Workers Will Work For Less Not To Commute Exhibit 82.-Median Wage & Salary Percent Difference Inland Empire vs. Coastal Counties, 2010 459 Common Occupations, Under $70,000 Weight Median Pay Percent IE Pay Is Lower $35,173 $34,656 $34,089 $33,240 5.81% 4.26% 2.55% 0.0% Inland Empire San Diego Los Angeles Orange Note: Occupations in common weighted by Inland Empire Jobs Source: CA Employment Development Department, Occupational Wage Survey, Economics & Politics, Inc. calculations
17 Firms Looking For Space7 Are Fulfillment Centers 1,500,000 1,000,000 1,000,000 800,000 to 1,000,000 700,000 to 1,000,000 500,000 to 800,000 700,000 to 900,000 850,000 700,000 700,000 700,000 to 800,000 600,000 600,000 to 700,000 500,000 450,000 300,000 to 400,000 350,000 Source: Jones LaSalle
Inland Empire Logistics Jobs 32.5% of All Inland Jobs … Jan-Nov. 2012-2013
Regulatory Environment Aimed At “Dirty” Blue Collar Sectors Impacts Construction, Manufacturing, Logistics
Poverty African American: 27.2% Hispanic: 23.9% White: 12.1% Asian: 10.4%
Office Absorption Finally Starting to Recover High-End Jobs Follow Workers into the Area
Outlying Workers Will Work For Less Not To Commute Exhibit 98.-Median Wage & Salary Percent Difference Inland Empire vs. Coastal Counties, 2010 138 Common Occupations, $70,000 & Up Weight Median Pay Percent IE Pay Is Lower $94,806 $94,768 $93,489 $86,806 9.17% 9.22% 7.70% 0.0% Inland Empire San Diego Los Angeles Orange Note: Occupations in common weighted by Inland Empire Jobs Source: CA Employment Development Department, Occupational Wage Survey, Economics & Politics, Inc. calculations
Inland Empire’s In-migration From Coastal Counties Has Not Yet Recovered -15,538 Not Bringing Skills, Wealth, Income & Spending
Health Care Jobs: Continuous Growth 700 600 800
Health Care Demand Set To Explode People Without Health Insurance (2012): 828,431 (19.0%) People Will Age, Already Those 55 & Over are 926,696 (21.3%) Population Growth Will Resume (2000-2013) 1,075,807 (33.0%) Inland Health Care Workers Handle More People Than CA: (35%)
Debt Ceiling Budget Fights Federal Job Cuts
Assessed Valuation Finally Growing (6.1% for SB County) -1.0%
How Regional Economies Work Secondary Tier Primary Tier