Wavelet Synopses with Error Guarantees
Wavelet Synopses with Error Guarantees. Minos Garofalakis and Phillip B. Gibbons* Information Sciences Research Center Bell Labs, Lucent Technologies *Currently with Intel Research-Pittsburgh http://www.bell-labs.com/user/minos/ http://www.intel-research.net/pittsburgh/people/gibbons/.


Wavelet Synopses with Error Guarantees
E N D
Presentation Transcript
Wavelet Synopses with Error Guarantees Minos Garofalakis and Phillip B. Gibbons* Information Sciences Research Center Bell Labs, Lucent Technologies *Currently with Intel Research-Pittsburgh http://www.bell-labs.com/user/minos/ http://www.intel-research.net/pittsburgh/people/gibbons/
Outline • Preliminaries & Motivation • Approximate query processing • Haar wavelet decomposition, conventional wavelet synopses • The problem • Our Solution: Probabilistic Wavelet Synopses • The general approach • Algorithms for Tuning our Probabilistic Synopses • Maximum relative error • Relative bias • Extensions to Multi-dimensional Haar Wavelets • Experimental Study • Results with synthetic & real-life data sets • Conclusions
Compact Data Synopses “Transformed” Query Approximate Answer KB/MB FAST!! Approximate Query Processing DecisionSupport Systems(DSS) SQL Query • Exact answers NOT always required • DSS applications usually exploratory: early feedback to help identify “interesting” regions • Aggregate queries: precision to “last decimal” not needed • e.g., “What percentage of the US sales are in NJ?” • Construct effective data synopses ?? Exact Answer Long Response Times! GB/TB
[1.5, 4] [0.5, 0] [2.75] [-1.25] Haar wavelet decomposition: [2.75, -1.25, 0.5, 0, 0, -1, -1, 0] Haar Wavelet Decomposition • Wavelets: mathematical tool for hierarchical decomposition of functions/signals • Haar wavelets: simplest wavelet basis, easy to understand and implement • Recursive pairwise averaging and differencing at different resolutions Resolution Averages Detail Coefficients 3 D = [2, 2, 0, 2, 3, 5, 4, 4] ---- 2 [2, 1, 4, 4] [0, -1, -1, 0] 1 0 • Construction extends naturally to multiple dimensions
+ 2.75 + - -1.25 0.5 0 0 -1 0 -1 + - + - + - + - + - + - 2 2 0 2 3 5 4 4 Haar Wavelet Coefficients • Reconstruct data values d(i) • d(i) = (+/-1) * (coefficient on path) • Range sum calculation d(l:h) • d(l:h) = simple linear combination of coefficients on paths to l, h • Only O(logN) terms • Hierarchical decomposition structure ( a.k.a. Error Tree ) Original data 3 = 2.75 - (-1.25) + 0 + (-1) 6 = 4*2.75 + 4*(-1.25)
Wavelet Data Synopses • Compute Haar wavelet decomposition of D • Coefficient thresholding : only B<<|D| coefficients can be kept • B is determined by the available synopsis space • Conventional thresholding: Take B largest coefficients in absolutenormalized value • Normalized Haar basis: divide coefficients at resolution j by • All other coefficients are ignored (assumed to be zero) • Provably optimal in terms of the overall Sum Squared (L2) Error • Unfortunately, this methodology gives no approximation-quality guarantees for • Individual reconstructed data values • Individual range-sum query results
Always accurate! Over 2,000% relative error! Estimate = 195, actual values: d(0:2)=285, d(3:5)=93! Problems with Conventional Synopses • An example data vector and wavelet synopsis (|D|=16, B=8 largest coefficients retained) Original Data Values 127 71 87 31 59 3 43 99 100 42 0 58 30 88 72 130 Wavelet Answers 65 65 65 65 65 65 65 65 100 42 0 58 30 88 72 130 • Large variation in answer quality • Within the same data set, when synopsis is large, when data values are about the same, when actual answers are about the same • Heavily-biased approximate answers! • Root causes • Strict deterministic thresholding • Independent thresholding ( large regions without any coefficient!) • Heavy bias from dropping coefficients without compensating for loss
Prob 204 1 204 20 -4 -6 -1 4 + -9 2/3 + -8 1/2 - 20 1 - 8 1/2 + with probability 1/6 -6 with probability - 183 185 Our Solution: Probabilistic Wavelet Synopses • Novel, probabilistic thresholding scheme for Haar coefficients • Ideas based on Randomized Rounding • In a nutshell • Assign coefficient probability of retention (based on importance) • Flip biased coins to select the synopsis coefficients • Deterministically retain most important coefficients, randomly rounding others either up to a larger value or down to zero • Key: Each coefficient is correct on expectation • Basic technique • For each non-zero Haar coefficient ci, define random variable Ci • Round each ci independently to or zero by flipping a coin with success probability (zeros are discarded)
Probabilistic Wavelet Synopses (cont.) • Each Ci is correct on expectation, i.e., E[Ci] = ci • Our synopsis guarantees unbiased estimators for data values and range sums (by Linearity of Expectation) • Holds for any ‘s , BUT choice of ‘s is crucial to quality of approximation and synopsis size • Variance of Ci: Var[Ci] = • By independent rounding, Variance[reconstructed di] = • Better approximation/error guarantees for smaller (closer to ci) • Expected size of the final synopsis E[size] = • Smaller synopsis size for larger • Novel optimization problems for “tuning” our synopses • Choose ‘s to ensure tight approximation guarantees (i.e., keep reconstruction variances small), while not exceeding the space bound B for the synopsis (i.e., E[size] B) • Alternative probabilistic scheme • Retain exact coefficient with probabilities chosen to minimize bias
Normalized Standard Error (NSE) of reconstructed value MinRelVar: Minimizing Max. Relative Error • Key metric for effective approximate answers: Relative error with sanity bound • Sanity bound “s” to avoid domination by small data values • Since estimate is a random variable, we want to ensure a tight bound for our relative error metric with high probability • By Chebyshev’s inequality • To provide tight error guarantees for all data values • Minimize the Maximum NSE among all reconstructed values
Error Tree root subject to and sum variances on path and normalize dk Minimizing Maximum Relative Error (cont.) • Problem: Find rounding values to minimize the maximum NSE • Hard non-linear optimization problem! • Propose solution based on a Dynamic Programming formulation • Key technical ideas • Exploit the hierarchical structure of the problem (error tree for Haar coefficients) • Quantizing the solution space
j 2j+1 2j Minimizing Maximum Relative Error (cont.) • Let = the probability of retaining ci • yi = “fractional space” allotted to coefficient ci ( yi B ) • M[j,b] = optimal value of the (squared) maximum NSE for the subtree rooted at coefficient cj for a space allotment of b • Normalization factors “Norm” depend only on the minimum data value in each subtree • See paper for full details... • Quantize choices for y to {1/q, 2/q, ..., 1} • q = input integer parameter, “knob” for run-time vs. solution accuracy • O(NBq^2) time, O(qB logN) memory
subject to and MinRelBias: Minimizing Normalized Bias • Scheme: Retain the exact coefficient ci with probability yi and discard with probability (1-yi) -- no randomized rounding • Our Ci random variables are no longer unbiased estimators for ci • Bias[Ci] = | E[Ci] - ci | = |ci|*(1-yi) • Choose yi’s to minimize an upper bound on the normalized reconstruction bias for each data value; that is, minimize • Same dynamic-programming solution as MinRelBias works! • Avoids pitfalls of conventional thresholding due to • Randomization • Choice of optimization metric (minimize max. resulting bias)
Extensions to Multi-dimensional Wavelets • Previous approaches suffer from additional bias due to construction-time thresholding • Data density can increase dramatically due to recursive pairwise averaging/differencing • Probabilistic thresholding ideas and algorithms can be extended to d-dimensional Haar wavelets • “Adaptively threshold” wavelet coefficients during the wavelet decomposition without introducing reconstruction bias • Basic ideas carry over directly • Linear data/range-sum reconstruction • Hierarchical “error-tree” structure for coefficients • Runtime of our dynamic-programming schemes increases by 2^d • Details in the paper...
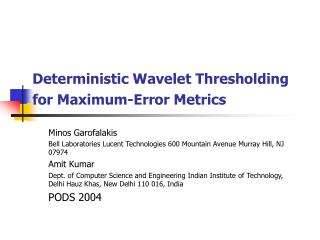
Experimental Study • Our probabilistic wavelet synopses vs. conventional (deterministic) wavelet synopses • Synthetic and real-life data sets • Zipfian data distributions • Various permutations, skew z = 0.3 - 2.0 • Forest Cover-Type data (UCI KDD repository) • Relative error metrics • Sanity bound = 10-percentile value in data • Mean, Maximum, and 25-percentile relative error in the approximation • Similar behavior for all metrics • Maximum relative error can be used as a “reconstruction error” guarantee • Quantization parameter q=10 for MinRelVar, MinRelBias
Mean Relative Error vs. Size • 256 distinct values 10 coefficients = 4% data synopsis
Conclusions • Introduced Probabilistic Wavelet Synopses • First wavelet-based data-reduction scheme to provably enable • Unbiased data reconstruction • Error guarantees on individual query answers • Novel optimization techniques for “tuning” our synopses • Minimize various desired error metrics • Extensions to multi-dimensional data • Experimental validation on synthetic and real-life data • Improve relative error by factors of 2 up to 80! • Future • Incremental maintenance of probabilistic wavelet synopses • Extend methodology & error guarantees to more complex queries (joins??)
and MinL2: Minimizing Expected L2 Error • Goal: Compute rounding values to minimize expected value of overall L2 error • Expectation since L2 error is now a random variable • Problem: Find that minimize , subject to the constraints • Can be solved optimally: Simple iterative algorithm, O(N logN) time • BUT, again, overall L2 error cannot offer error guarantees for individual approximate answers (data/range-sum values)