Download
1 / 14
140 likes | 155 Vues
This project aims to calculate the energy distribution incident on the gold mask using the April 2012 data. The CA data will not be used as input, but rather various relative flux measurements will be compared to infer the energy spectrum. Inputs to the calculation include the high energy shape from Jackson, known transmissions for various filters, and uncertain properties of the detector.

E N D
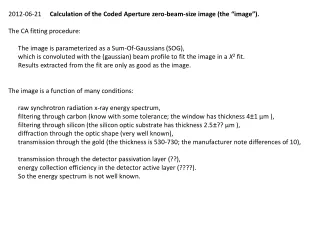
2012-06-21 Calculation of the Coded Aperture zero-beam-size image (the “image”). The CA fitting procedure: The image is parameterized as a Sum-Of-Gaussians (SOG), which is convoluted with the (gaussian) beam profile to fit the image in a Χ2 fit. Results extracted from the fit are only as good as the image. The image is a function of many conditions: raw synchrotron radiation x-ray energy spectrum, filtering through carbon (know with some tolerance; the window has thickness 4±1 μm ), filtering through silicon (the silicon optic substrate has thickness 2.5±?? μm ), diffraction through the optic shape (very well known), transmission through the gold (the thickness is 530-730; the manufacturer note differences of 10), transmission through the detector passivation layer (??), energy collection efficiency in the detector active layer (????). So the energy spectrum is not well known.
2012-06-20 Past efforts: John made direct calculations. Filters: Includes Diamond, Silicon, SiN (passivation), InP, InGaAs (diode) Input raw x-ray spectrum: I can not tell from the file, but the critical energy is wrong. The resultant x-ray energy spectrum was questioned; I can not find the email. But this was motivation to charge ahead. An added concern was that the resulting image requires an added background to fit the data. Below is John’s transmission, applied to Jackson 14.88 (energy spectrum on the orbit plane, small vertical aperture)
2012-06-20 Past Efforts: Dan made various calculations, Jan 2011 - April 2012, adjusting the energy spectrum and gold thickness to provide a match between the image and the data. Jan 2012: 5 energies, single transmission and phase April 2012: 5 energies with wider spacing, energy dependent transmission and phase.
2012-06-20 Current goal: Use the April 2012 data to calculate the energy distribution incident on the gold mask. April data: C-line, 3 energies: 2.085, 1.8, 2.3 3 optics: pinhole, Coded Aperture, The Edge The Plan: Various relative flux measurements can be compared (data to calculation) to infer the energy spectrum. The CA data will not be used as input to the calculation.
2012-06-20 Inputs to the calculation: The high energy shape, or cut-off, of the synchrotron radiation spectrum is taken from Jackson. The critical angle is θc = 1/γ (ω/ωc ) 1/3 (Jackson 14.89) for 2.3 GeV, γ = 4501, at 7.5 keV, ω/ωc = 4.307 thus, at 2.3 GeV beam and 7.5 keV x-ray, θc = 1.4 x 10⁻⁴ radians and, the full optics height corresponding to this angle is , θc * 2 * ObjectDistance = 1200 μm. The height of the Coded Aperture is only 600 μm, so the equation for energy spectrum on the orbit plane may be used. δI(ω)/δΩ|θ=0 = 3/(2π) e2/c γ2ω/ωc exp( -2ω/ωc ) Jackson 14.88 The transmissions for various filters: carbon, molybdenum, gold, silicon are known. The thicknesses of the gold, molybdenum, and silicon are taken as “known”. The thickness of the carbon has a tolerance, and is 4±1 μm. We also do not know the properties of the detector. This uncertainty is thrown into a simple x-ray energy dependence, (Ex-ray)n.
2012-06-15 key: DATA { model with (Ex-ray)1.84 scaling, 4 μm carbon} raw numbers no filter carbon filter molybdenum filter 1.800 GeV { 3378 }{ 964 } { 77.1 } 2.085 GeV { 10186 } { 5294 }{ 553.7} 2.300 GeV { 21264 } { 14162 } { 1972 } normalized no filter carbon filter molybdenum filter 1.800 GeV 0.304 { 0.332 } 0.079 { 0.095 } ----- { 0.0076 } 2.085 GeV 1 { 1 } 0.520 { 0.520 }* 0.050 { 0.054 } 2.300 GeV --- { 2.088 } 1.611 { 1.390 } 0.251 {0.193 } * this is a tuned value
2012-06-15 Increase the carbon thickness to decrease the 1.8GeV ratios and increase the 2.3GeV ratios. key: DATA { model with (Ex-ray)2.06 scaling, 5.0 μm carbon} raw numbers TASGAP no filter carbon filter molybdenum filter 1.800 GeV 5.1 { 2633 }{ 724 } { 66.9 } 2.085 GeV 5.1 { 8508 } { 4420}{ 509.4 } 2.300 GeV 4.9 { 18774 } { 12598 } { 1935 } normalized TASGAP no filter carbon filter molybdenum filter 1.800 GeV 5.1 0.304 { 0.309 } 0.079 { 0.085} ----- { 0.0078} 2.085 GeV 5.1 1 { 1 } 0.520 { 0.520 }* 0.050 { 0.060 } 2.300 GeV 4.9 --- { 2.207 } 1.611 { 1.481 } 0.251 {0.227 } 2.300 GeV scaled to 5.1 --- { 2.207 } 1.917 { 1.481 } 0..299 {0.227 } * this is a tuned value The increase to 5.0 μm carbon has improved the agreement with data. However, after compensating the 2.3GeV data to account for the decreased pinhole size, the increase in the carbon thickness is not sufficient.
2012-06-21 The EDGE allows measurements of x-ray flux with 2 other filter configurations 2.5 μm Silicon with 0.53 μm Gold and 2.5 μm Silicon. The x-ray beam is centered at the edge of the rectangular opening on the optics chip. The EDGE can also be further filtered with or without the diamond filter. Thus, there are 4 combinations of filters. with diamond filter without diamond filter
2012-06-20 key: DATA { model with (Ex-ray)2.06 scaling, 5.0 μm carbon} raw numbers no filter carbon filter 2.085 GeV Pinhole 531.22 { 8508 } 276.27 { 4420 } 2.085 GeV Edge Low (Si and Au) 50.22 { 211.8 } 31.07 { 163.2 } 2.085 GeV Edge High (Si ) 262.67 { 1306.1 } 151.44 { 822.5} EDGE height per Pinhole area (Edge with Carbon is normalized to Pinhole with Carbon) Data is normalized to the simple optic horizontal width. Pinhole width=500 μm, EDGE width =1200μm. no filter carbon filter 2.085 GeV Pinhole 1 { 1 } 1 { 1 } 2.085 GeV Edge Low (Si and Au) 0.039 { 0.025 } 0.047 { 0.037 } 2.085 GeV Edge High (Si ) 0.206 { 0.154 } 0.228 { 0.186} Low/High ratio 0.191 { 0.162 } 0.205 { 0.198 } In all cases, the data is higher than the calculated; the Low/High ratio does not match for “no filter” Ratio of data/calculated 2.085 GeV Edge Low (Si and Au) 1.56 1.27 2.085 GeV Edge High (Si ) 1.34 1.23
2012-06-13 interpretation of EG1 images 1200 μm The Low/High ratio would be increased in the calculation by including some side-band. The horizontal width of the beam may be wider than the 1200 μm width of the opening. The horizon limiting aperture is 3175 μm. Inclusion of a side-band would also increase all levels. This would also increase the Low/High ratio for the carbon filter. The measured Low/High ratio for no carbon filter is low while the measured ratio with the carbon filter is correct. This implies that the x-ray power spectrum should be increased where there is high gold transmission and reduced carbon transmission. I have done some preliminary tests with poor results. “the EDGE” 3175 μm
2012-06-19 C-line Coded Aperture, 0.53 μm gold, NO carbon filter “suggested pulse height uncertainty” = 233.28
2012-06-19 C-line Coded Aperture, 0.53 μm gold, 5μm carbon filter “suggested pulse height uncertainty” = 242.78
run area RMSE fitted sigma pixel magn raw subtract beam size pixelsmicrons microns microns microns CA no diamond 023648 2914 .706 0.810 50 2.52 16.07 5.76 15.0 CA with diamond 023649 1481 .407 0.784 50 2.52 15.56 5.76 14.5 Pinhole 023657 615 .484 1.118 50 2.52 22.18 16 .0 15.4
2012-06-21 To do: Compare the D-line Pinhole data to C-line. (We have the recorded currents.) Compare the D-line Low/High ratio to the calculation. (We did not record the currents.) This is 690 μm gold and should have a reduced ratio and be less sensitive to the side-band. measured { calculated } Low/High, with Carbon, C-line 0.205 { 0.198 } D-line 0.147 { 0.131 } Further investigate the inclusion of side-band in the C-line calculation. deviations from the simple, applied x-ray energy dependence, (Ex-ray)n .