Download
1 / 59
590 likes | 783 Vues
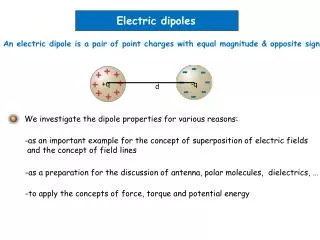
Data Guided Discovery of Dynamic Dipoles. Dipoles. Dipoles represent a class of teleconnections characterized by anomalies of opposite polarity at two locations at the same time. Dipoles.

E N D
Dipoles Dipoles represent a class of teleconnections characterized by anomalies of opposite polarity at two locations at the same time.
Dipoles Dipoles represent a class of teleconnections characterized by anomalies of opposite polarity at two locations at the same time.
Dipoles Dipoles represent a class of teleconnections characterized by anomalies of opposite polarity at two locations at the same time. North Atlantic Oscillation: Iceland and Azores Southern Oscillation: Tahiti and Darwin North Atlantic Oscillation: Iceland and Azores
Importance of Dipoles Crucial for understanding the climate system, especially for weather and climate forecast simulations within the context of global climate change. NAO influences sea level pressure (SLP) over most of the Northern Hemisphere. Strong positive NAO phase (strong Islandic Low and strong Azores High) are associated with above-average temperatures in the eastern US. SOI dominates tropical climate with floodings over East Asia and Australia, and droughts over America. Also has influence on global climate. Correlation of Land temperature anomalies with NAO Correlation of Land temperature anomalies with SOI
Related Work to find Dipoles • Discovered earlier by human observation. • NAO observed in 1770-17781 • SOI observed by Sir Gilbert Walker as a sea-saw like oscillation of sea level pressure in the Pacific Ocean in 19242 • EOF analysis used to identify individual dipoles for the Arctic Oscillation (AO) and Antarctic Oscillation (AAO)3 • Similar to PCA, decomposes the time series into orthogonal basis functions. AO: EOF Analysis of 20N-90N Latitude AAO: EOF Analysis of 20S-90S Latitude • H. van Loon and J. C. Rogers. The seesaw in winter temperatures between greenland and northern europe. Part i: General description. Monthly Weather Review, 106(3):296{310, 1978} • G. Walker. Correlation in seasonal variations of weather, viii. a preliminary study of world weather. Memoirs of the India Meteorological Department, 24(4):75{131, 1923} • H. Von Storch and F. Zwiers. Statistical analysis in climate research. Cambridge Univ Pr, 2002 • Portis, D. H., Walsh, J. E., El Hamly, Mostafa and Lamb, Peter J., Seasonality of the North Atlantic Oscillation, Journal of Climate, vol. 14, pg. 2069- 2078, 2001
Motivation for Automatic Discovery of Dipoles • The known dipoles are defined by static locations but the underlying phenomenon is dynamic • Manual discovery can miss many dipoles • EOF and other types of eigenvector analysis finds the strongest signals and the physical interpretation of those can be difficult. • Enables analysis of the various GCMs Dynamic behavior of the high and low pressure fields corresponding to NOA climate index (Portis et al, 2001) AO: EOF Analysis of 20N-90N Latitude AAO: EOF Analysis of 20S-90S Latitude
Shared Reciprocal Nearest Neighbors • Reciprocity: Two nodes A and B are reciprocal if they lie on each other’s nearest neighbor list. • Helps in noise reduction. (asymptotic reduction is θ(N/K). • Removes noise such as weakly correlated regions and anomalous connections. A B C B E D A F E D
Overall Algorithm: Discovering Climate Teleconnections using SRNN Shared Reciprocal Nearest Neighbors (SRNN) Density Climate Network Nodes in the Graph correspond to grid points on the globe. Edge weight corresponds to correlation between the two anomaly timeseries Dipoles from SRNN density
Benefits of Automatic Dipole Discovery • Detection of Global Dipole Structure • Most known dipoles discovered • New dipoles may represent previously unknown phenomenon. • Enables analysis of relationships between different dipoles • Location based definition possible for some known indices that are defined using EOF analysis. • Dynamic versions are often better than static • Dipole structure provides an alternate method to analyze GCM performance
Detection of Global Dipole Structure NCEP (National Centers for Environmental Prediction) Reanalysis NCEP (National Centers for Environmental Prediction) Reanalysis Data PNA WP NAO AO SOI AAO ACC • Most known dipoles discovered • Location based definition possible for some known indices that are defined using EOF analysis. • New dipoles may represent previously unknown phenomenon.
Comparing Dipole Structure in Historical (Reanalysis) Data 13 NCEP 1979-2000 ERA-40 1979-2000 JRA-25 1979-2000
Statistical Significance of Dipoles 14 NCEP 1 JRA-25 ERA-40
Results: Location Based definition AO • Mean Correlation between static and dynamic index: 0.84 • Impact on land temperature anomalies comparatively same using static and dynamic index Static AO: EOF Analysis of 20N-90N Latitude Impact on Land temperature Anomalies using Static and Dynamic AO
Results: Location Based definition AAO • Mean Correlation between Static and Dynamic index = 0.88 • Impact on land temperature anomalies comparatively same using static and dynamic index Static AAO: EOF Analysis of 20S-90S Latitude Impact on Land temperature Anomalies using Static and Dynamic AAO
Static vs Dynamic NAO Index: Impact on land temperature The dynamic index generates a stronger impact on land temperature anomalies as compared to the static index. Figure to the right shows the aggregate area weighted correlation for networks computed for different 20 year periods during 1948-2008.
Static vs Dynamic SO Index: Impact on land temperature The dynamic index generates a stronger impact on land temperature anomalies as compared to the static index. Figure to the right shows the aggregate area weighted correlation for networks computed for different 20 year periods during 1948-2008.
A New Dipole Around Antarctica? • 3 major dipole structures can be seen. • The AAO and two others shown in figure • A newer phenomenon which is not captured by the EOF analysis? Correlation plot with major dipoles
Correlation with land temperature AAO AAO • Comparison of dipoles by looking at land temperature impact. • Significant difference between the AAO impact and that due to dipoles 1,2,3 which are similar • It is possible that this may be a new phenomenon but this is still under speculation. 2 1 3 1 3
Dipoles not captured by EOF AAO • EOF Analysis does not capture some dipoles • Mixture of SOI and AAO • The land area impact is also different Courtesy of Climate Prediction Center SOI New Dipole
Correlation of AAO index with other dipoles (1979-2000) ERA-40 JRA-25 NCEP Mean Model
Correlation of the new dipole with other dipole indices. ERA-40 JRA-25 Mean Model NCEP
Relating Dipole Structure to Climate Models • The dipole structure of the top 2 models are different from the bottom two models • NCAR-CCSM and NASA-GISS miss SOI and other dipoles near the Equator Disagreement between IPCC models NCAR-CCSM NASA-GISS MIROC_3_2 UKMO-HadCM3