Download
1 / 24
240 likes | 310 Vues
Explore Canada’s RAQDPS functioning, AQ outputs, generation methods, and accuracy. Learn about AQHI index, forecasting system, and GEM-MACH15 model configuration. Get detailed insights on inputs, chemical weather forecasts, and evaluation results.

E N D
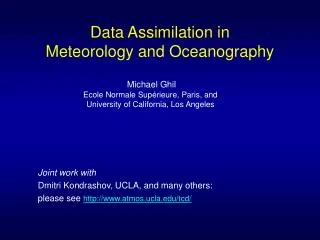
Mtg on AQ Data Assimilation and Fusion R&D, 16-17 Jan. 2012, Downsview, ON EC Regional Air Quality Deterministic Prediction System (RAQDPS)Mike MoranAir Quality Research DivisionEnvironment Canada, Toronto, Ontario
Talk Outline • Short overview of current EC RAQDPS • What are the AQ outputs? • How are they generated? • How good are they? • Future plans
AQHI: Canada’s National Air Quality Health Index • Follows example of Canadian national UV index • Year-round, health-based, additive, no-threshold, hourly AQ index • Developed from daily time-series analysis of air pollutant concentrations and mortality data (Stieb et al., 2008) • Weighted sum of NO2, O3, & PM2.5 concentrations • 0 to 10+ range
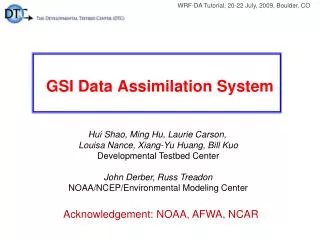
Canadian AQ Forecasting System • Primary messaging tool is the AQHI • Main target is urban areas > 100,000 population • Current RAQDPS is GEM-MACH15, a coupled AQ / Wx forecast model that provides twice-daily48-hour forecasts of hourly AQHI component (NO2, O3, PM2.5) fields, other AQ fields, and meteorological fields • UMOS-AQ/MIST statistical post-processing package combines GEM-MACH15 predicted AQ and met fields with previous day’s NO2, O3, and PM2.5 measurements to forecast hourly AQHI component values at AQ station locations (data fusion step: large reduction in bias)
GEM-MACH is a multi-scale, first-principles, chemical weather forecast model composed of dynamics, physics, and in-line chemistry modules GEM-MACH15 is a particular configuration of GEM-MACH chosen to meet EC’s operational AQ forecast needs; its key characteristics include: limited-area-model (LAM) grid configuration for North America 15-km horizontal grid spacing, 58 vertical levels to 0.1 hPa 2-bin sectional representation of PM size distribution (i.e., 0-2.5 and 2.5-10 μm) with 9 chemical components (SO4, NO3, NH4, EC, POA, SOA, CM, S-S, H2O) forecast species include O3, NO2, and PM2.5 needed for AQHI plus other gas- and particle-phase concentration and flux fields GEM-MACH and GEM-MACH15
GEM-LAM15 is EC’s limited-area regional weather forecast model • GEM-MACH15’s grid points are co-located with GEM-LAM15 grid points • GEM-LAM15 supplies meteorological initial conditions and lateral boundary conditions to GEM-MACH15 GEM-LAM15 and GEM-MACH15 Grids GEM-LAM15 core grid (blue); GEM-MACH15 grid (red)
Key GEM-MACH15 Inputs: Emissions (1) • AQ forecasting is a mixed IV/BV problem • GEM-MACH15 is a source-oriented prognostic deterministic Eulerian model • Pollutant and precursor emissions from all sources are a key input to GEM-MACH, including natural sources such as biogenic emissions, sea salt, wildfires, wind-blown dust, and lightning NOx (only biogenic emissions and sea salt are included now)
Key GEM-MACH15 Inputs: Emissions (2) • Accuracy of input emissions fields is limited by (a) accuracy of emissions inventories and (b) accuracy of emissions processing (spatial, temporal, and size disaggregation, chemical speciation) • Only emissions from large U.S. power plants are directly measured (but are not known in future); all other emissions are estimated
Sample Spatial Surrogates – Saskatchewan Primary Highways (red) and Secondary Highways (blue)
Temporal Surrogate – LDGV Diurnal Profiles for Weekdays vs. Weekends (FEVER data)
Key GEM-MACH15 Inputs: Chemical Lateral Boundary Conditions • Currently use static climatological seasonal vertical profiles for all species (limiting!) • Only CO varies in space • Reasonably good approximation for reactive short-lived species, less so for medium- to long-lived species such as PM, O3, and CO • Advantageous to locate lateral boundaries over “clean” regions such as oceans
2-Year Performance Evaluation Results for GEM-MACH15 • Considered 2-year period from 1 Aug. 2009 to 31 July 2011 • Looked at Year 1 (2009-10) vs. Year 2 (2010-11) • Used archived near-real-time hourly O3, PM2.5, and NO2 Canadian data from National Air Pollutant Surveillance (NAPS) network stations and hourly O3 and PM2.5 U.S. data from AIRNow • Performed some limited screening for outliers
Minimum number of available Canadian and U.S. stations in 2009-2011 for O3, PM2.5, and NO2 in the Oct.–Mar. and Apr.–Sept. periods
Year 1 Annual Correlation (R) Values PM2.5 NO2 O3
Year 1 & Year 2 Annual Time Series Of National-Average Daily Maximum 1-h O3 Concentrations At Canadian & U.S. Stations Cda Year 1 Cda Year 2 U.S. Year 1 U.S. Year 2
Year 1 & Year 2 Annual Time Series Of National-Average Daily Max’m 1-h PM2.5 Concentrations At Canadian & U.S. Stations
Year 1 & Year 2 Annual Time Series Of National-Average Daily Maximum 1-h NO2 Concentrations At Canadian Stations Cda Year 1 Cda Year 2
WCAN ECAN WUSA EUSA Regions for Model Evaluation
Monthly Variation Of Regional Mean NMB For Daily Maximum PM2.5 For 4 Regions For Full 2 Years
Future Plans (Short- / Medium- / Long-term) S Migration to IBM p7 computer S Reduced grid spacing (15 10? km) S Further improvements to emissions files S/M Improved process representations M Migration to GEMv4 (new staggered vertical discretization, updated chemistry bus, piloting at top of limited-area grid) M Improved initialization using objectively- analyzed model-measurement fields M/L Longer forecasts (48 72+ h)
Summary • Current EC RAQDPS produces twice-daily 48-hour forecasts of hourly AQ concentration fields on North American domain with 15-km grid spacing • GEM-MACH15 performance is limited by accuracy of • meteorological forecasts • input emissions fields • chemical lateral boundary conditions • process representations • horizontal and vertical resolution • Preliminary GEM-MACH15 performance evaluation is available for 2009-2011 period • Further performance improvements are expected in next 18 months from implementation of new versions