Download
1 / 1
10 likes | 188 Vues
Automated analysis of cytometric profiles of synovial fluid and peripheral blood in rheumatoid arthritis Till Sörensen 1 , Ursula Schulte- Wrede 2 , Silvia Pade 1 , Heike Hirseland 2 , Gerd Burmester 1 , Andreas Radbruch 2 , Andreas Grützkau 2 , Thomas Häupl 1

E N D
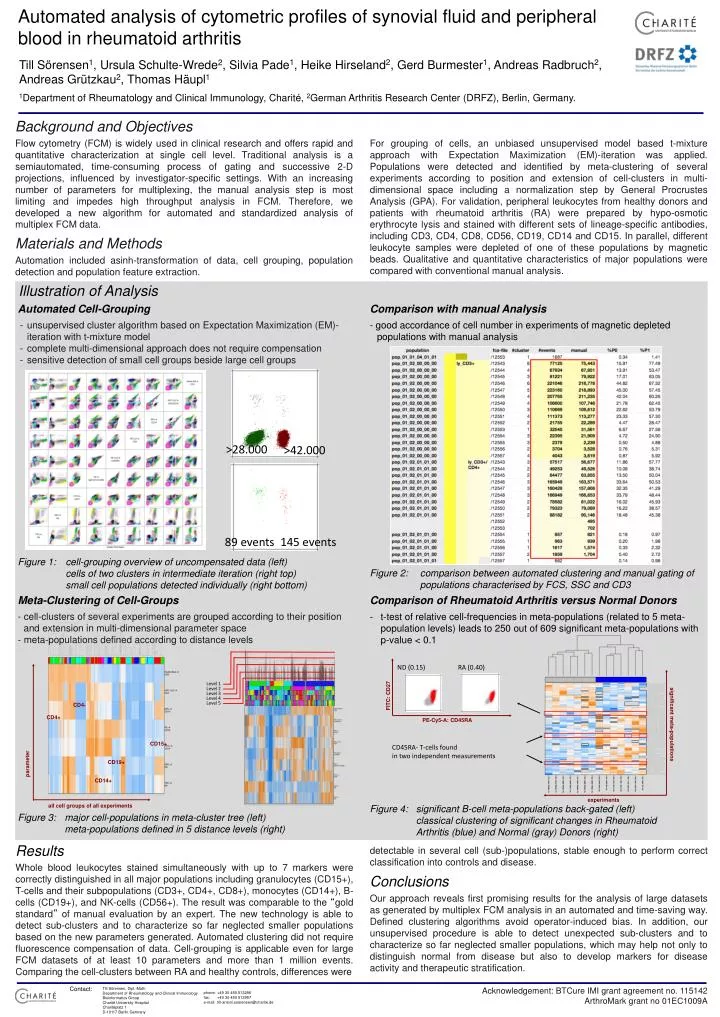
Automatedanalysisofcytometricprofilesofsynovial fluid and peripheralblood in rheumatoid arthritis Till Sörensen1, Ursula Schulte-Wrede2, Silvia Pade1, Heike Hirseland2, GerdBurmester1, Andreas Radbruch2, Andreas Grützkau2, Thomas Häupl1 1Department of Rheumatology and Clinical Immunology, Charité, 2German Arthritis Research Center (DRFZ), Berlin, Germany. Background and Objectives Flow cytometry (FCM) is widely used in clinical research and offers rapid and quantitative characterization at single cell level. Traditional analysis is a semiautomated, time-consuming process of gating and successive 2-D projections, influenced by investigator-specific settings. With an increasing number of parameters for multiplexing, the manual analysis step is most limiting and impedes high throughput analysis in FCM. Therefore, we developed a new algorithm for automated and standardized analysis of multiplex FCM data. For grouping of cells, an unbiased unsupervised model based t-mixture approach with Expectation Maximization (EM)-iteration was applied. Populations were detected and identified by meta-clustering of several experiments according to position and extension of cell-clusters in multi-dimensional space including a normalization step by General Procrustes Analysis (GPA). For validation, peripheral leukocytes from healthy donors and patients with rheumatoid arthritis (RA) were prepared by hypo-osmotic erythrocyte lysis and stained with different sets of lineage-specific antibodies, including CD3, CD4, CD8, CD56, CD19, CD14 and CD15. In parallel, different leukocyte samples were depleted of one of these populations by magnetic beads. Qualitative and quantitative characteristics of major populations were compared with conventional manual analysis. Materials and Methods Automation included asinh-transformation of data, cell grouping, population detection and population feature extraction. Illustration of Analysis Automated Cell-Grouping Comparison with manual Analysis • - unsupervised cluster algorithm based on Expectation Maximization (EM)-iteration with t-mixture model • - complete multi-dimensional approach does not require compensation • - sensitive detection of small cell groups beside large cell groups - good accordance of cell number in experiments of magnetic depleted populations with manual analysis >28.000 >42.000 89 events 145 events Figure 1: cell-grouping overview of uncompensated data (left) cells of two clusters in intermediate iteration (right top) small cell populations detected individually (right bottom) Figure 2: comparison between automated clustering and manual gating of populations characterised by FCS, SSC and CD3 Meta-Clustering of Cell-Groups Comparison of Rheumatoid Arthritis versus Normal Donors - cell-clusters of several experiments are grouped according to their position and extension in multi-dimensional parameter space - meta-populations defined according to distance levels • t-test of relative cell-frequencies in meta-populations (related to 5 meta-population levels) leads to 250 out of 609 significant meta-populations with p-value < 0.1 ND (0.15) RA (0.40) Level 1 FITC: CD27 Level 2 Level 3 Level 4 Level 5 CD4- CD4+ PE-Cy5-A: CD45RA parameter significant meta-populations CD15+ CD45RA- T-cells found in two independent measurements CD19+ CD14+ experiments all cell groups of all experiments Figure 4: significant B-cell meta-populations back-gated (left) classical clustering of significant changes in Rheumatoid Arthritis (blue) and Normal (gray) Donors (right) Figure 3: major cell-populations in meta-cluster tree (left) meta-populations defined in 5 distance levels (right) Results detectable in several cell (sub-)populations, stable enough to perform correct classification into controls and disease. Whole blood leukocytes stained simultaneously with up to 7 markers were correctly distinguished in all major populations including granulocytes (CD15+), T-cells and their subpopulations (CD3+, CD4+, CD8+), monocytes (CD14+), B-cells (CD19+), and NK-cells (CD56+). The result was comparable to the “gold standard” of manual evaluation by an expert. The new technology is able to detect sub-clusters and to characterize so far neglected smaller populations based on the new parameters generated. Automated clustering did not require fluorescence compensation of data. Cell-grouping is applicable even for large FCM datasets of at least 10 parameters and more than 1 million events. Comparing the cell-clusters between RA and healthy controls, differences were Conclusions Our approach reveals first promising results for the analysis of large datasets as generated by multiplex FCM analysis in an automated and time-saving way. Defined clustering algorithms avoid operator-induced bias. In addition, our unsupervised procedure is able to detect unexpected sub-clusters and to characterize so far neglected smaller populations, which may help not only to distinguish normal from disease but also to develop markers for disease activity and therapeutic stratification. Contact: Acknowledgement: BTCure IMI grant agreement no. 115142 ArthroMark grant no 01EC1009A Till Sörensen, Dipl.-Math. Department of Rheumatology and Clinical Immunology Bioinformatics Group Charité University Hospital Charitéplatz 1 D-10117 Berlin Germany phone: +49 30 450 513296 fax: +49 30 450 513957 e-mail: till-antoni.soerensen@charite.de