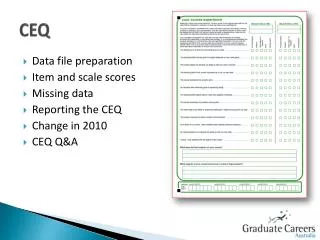
CEQ
CEQ. Data file preparation Item and scale scores Missing data Reporting the CEQ Change in 2010 CEQ Q&A. What is the CEQ?. Course experience perceptions of graduates who completed coursework degrees Research degree graduates respond to the PREQ Feedback on up to two majors

CEQ
E N D
Presentation Transcript
CEQ • Data file preparation • Item and scale scores • Missing data • Reporting the CEQ • Change in 2010 • CEQ Q&A
What is the CEQ? • Course experience perceptions of graduates who completed coursework degrees • Research degree graduates respond to the PREQ • Feedback on up to two majors • More responses than respondents • Eleven scales underpinned by 49 Likert-type items • Three core scales consisting of 13 items
Good Teaching Scale (GSS) [6] • Generic Skills Scale (GSS) [6] • Overall Satisfaction Item (OSI) [1] • Clear Goals and Standards Scale (CGS) [4] • Appropriate Workload Scale (AWS) [4] • Appropriate Assessment Scale (AAS) [3] • Intellectual Motivation Scale (IMS) [4] • Student Support Scale (SSS) [5] • Graduate Qualities Scale (GQS) [6] • Learning Resources Scale (LRS) [5] • Learning Community Scale (LCS) [5]
Data File Preparation • Remove PREQ cases • Remove cases with no CEQMAJ • Imputation possible from MAJ1 and MAJ2 • Remove cases with no LEVEL • Remove cases that do not fulfil these conditions: • valid response to OSI, or • at least four GTS item responses, or • at least four GSS item responses • All collection methods retained for 2010 CEQ
Creation of Response File GDS CEQ1 CEQ2 • 113,523 respondents • 131,603 responses
Item Scores • Common five-point response scale • 1 = strongly disagree • 2 = disagree • 3 = neither agree nor disagree • 4 = agree • 5 = strongly agree • Some items reverse coded • CEQ Reporting metrics: • 1 = -100; 2 = -50; 3 = 0; 4 = 50; 5 = 100 (CEQ) • 1 = 0; 2 = 0; 3 = 0; 4 = 100; 5 = 100 (PA) • 1 = 0; 2 = 0; 3 = 100; 4 = 100; 5 = 100 (BA)
Scale Scores • Mean of item scores • Minimum item scores: • 1 for OSI • 2 for AAS • 3 for AWS, CGS, IMS • 4 for GQS, GSS, GTS, LCS, LRS, SSS • Item scores removed if scale score not computed • CEQ scores are normally distributed
Missing Data • Planned: • Optional scale not included • From < 0.1% to 1.8% of responses • Unplanned: • Item non-response
SPSS Syntax • START • Resource library • Data files • CEQ • 2010
Reporting the CEQ • START • Resource library • Reports • 2010
Tables on START • START • Resource library • Data files • CEQ • 2010 • Save target as… • Save link as…
Change in Response • Concern that graduates were misreading the direction of the response scale • Positive comments accompanying negative scores It was awesome!!!
Endpoint-only labels 1992-2009 • All points labelled 2010- following resolution by SRG at July 2009 meeting
Yearly changes in CEQ scores typically incremental • Sample composition consistent between 2009-10 • Response scale change flagged as potential cause • Discussion paper prepared • Core items • Hardcopy/online responses
Perspectives from Literature • Denoting agreement/disagreement makes valence of positive/negative response more explicit (Weijters, 2010) • Respondents generally have a desire to be agreeable (McClendon, 1991) • Fully-labelled response scale results in an upward shift in the response distribution (Guterbock and Hubbard, 2000) • Greater accessibility of labelled response categories is likely to cause a shift away from the midpoint (Simonson, 1989)
‘Neither agree nor disagree’ or ‘Undecided’? • Ambiguity of unlabelled midpoint
Conclusions • Shift in response distribution likely due to labelling • Upward shift from midpoint (‘N’) to fourth point (‘A’) • Consistent with literature • 2010 beginning new CEQ time series • Positive development for the CEQ: • More consistent responses • More in line with PREQ response scale • CEQ review—response scale likely reassessed