Optimizing I/O Performance Using Queuing Theory
Learn how to quantify I/O performance and unique measures using queuing theory. Discover the best benchmarks like TPC-C and SPEC to measure system performance.


Optimizing I/O Performance Using Queuing Theory
E N D
Presentation Transcript
12 Storage SystemsPerformance Kai Bu kaibu@zju.edu.cn http://list.zju.edu.cn/kaibu/comparch2018
Preview • I/O Performance • Queuing Theory quantify /calculate
I/O Performance • Queuing Theory
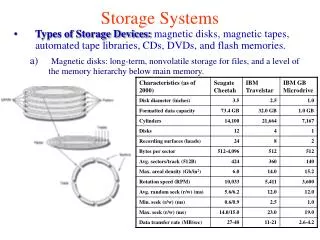
Unique Measures • Diversity which I/O devices can connect to the computer system? • Capacity how many I/O devices can connect to a computer system?
Producer-Server Model producer creates tasks to be performed and places them in a buffer; server takes tasks from the FIFO buffer and performs them;
Metrics • Response time / Latency the time a task from the moment it is placed in the buffer until the server finishes the task • Throughput / Bandwidth the average number of tasks completed by the server over a time period
Throughput vs Response Time Competing demands • Highest possible throughput requires server never be idle, thus the buffer should never be empty • Response time counts time spent in the buffer, so an empty buffer shrinks it
Choosing Response Time • Transaction an interaction between user and comp • Transaction Time consists of Entry time: the time for the user to enter the command System response time: the time between command entered and complete response displayed Think time: the time from response reception to user entering next cmd
Choosing Response Time reduce response time from 1 s to 0.3 s
Choosing Response Time More transaction time reduction than just the response time reduction
Choosing Response Time People need less time to think when given a faster response
I/O Benchmarks Response time restrictions for I/O benchmarks
TPC • Conducted by Transaction-Processing Council OLTP for online transaction processing • I/O rate: the number of disk accesses per second; instead of data rate (bytes of data per second)
TPC-C Configuration • use a database to simulate an order-entry environment of a wholesale supplier • Include entering and delivering orders, recording payments, checking the status of orders, and monitoring the level of stock at the warehouses • Run five concurrent transactions of varying complexity • Includes nine tables with a scalable range of records and customers
TPC-C Metrics • tmpC transactions per minute • System price hardware software three years of maintenance support
TPC: Initiative/Unique Characteristics • Price is included with the benchmark results • The dataset generally must scale in size as the throughput increases • The benchmark results are audited • Throughput is performance metric, but response times are limited • An independent organization maintains the benchmarks
SPEC Benchmarks • Best known for its characterization of processor performances • Has created benchmarks for also file servers, mail servers, and Web servers SFS, SPECMail, SPECWeb
SPEC File Server Benchmark • SFS a synthetic benchmark agreed by seven companies; evaluate systems running the Sun Microsystems network file sys (NFS); • SFS 3.0 / SPEC SFS97_R1 to include support for NFS version 3
SFS • Scale the amount of data stored according to the reported throughput • Also limits the average response time
SPECMail • Evaluate performance of mail servers at an Internet service provider • SPECMail 2001 based on standard Internet protocols SMTP and POP3; measures throughput and user response time while scaling the number of users from 10,000 to 1,000,000
SPECWeb • Evaluate the performance of World Wide Web servers • Measure number of simultaneous user sessions • SPECWeb2005 simulates accesses to a Web service provider; server supports home pages for several organizations; three workloads: Banking (HTTPs), E-commerce (HTTP and HTTPs), and Support (HTTP)
Dependability BenchmarkExamples • TPC-C • The benchmarked system must be able to handle a single disk failure • Measures submitters run some RAID organization in their storage system
Dependability BenchmarkExamples • Effectiveness of fault tolerance • Availability: measured by examining the variations in system quality-of-service metrics over time as faults are injected into the system • For a Web server performance: requests satisfied per second degree of fault tolerance: the number of faults tolerated by the storage system, network connection topology, and so forth
Dependability BenchmarkExamples • Effectiveness of fault tolerance • SPECWeb99 • Single fault injection e.g., write error in disk sector • Compares software RAID implementations provided by Linux, Solaris, and Windows 2000 Server
SPECWeb99 fast reconstruction decreases app performance reconstruction steals I/O resources from running apps
SPECWeb99 • Linux and Solaris initiate automatic reconstruction of the RAID volume onto a hot spare when an active disk is taken out of service due to a failure • Windows’s RAID reconstruction must be initiated manually
SPECWeb99 Managing transient faults • Linux: paranoid shut down a disk in controlled manner at the first error, rather than wait to see if the error is transient; • Windows and Solaris: forgiving ignore most transient faults with the expectation that they will not recur
I/O Performance • Queuing Theory
Queuing Theory • Give a set of simple theorems that will help calculate response time and throughput of an entire I/O system
Queuing Theory • Because of the probabilistic nature of I/O events and because of sharing of I/O devices • A little more work and much more accurate than best-case analysis, but much less work than full-scale simulation
Black Box Model I/O Device • Processor makes I/O requests that arrive at the I/O device, • requests depart when the I/O device fulfills them
Flow-balanced State I/O Device • If the system is in steady state, then the number of tasks entering the system must equal the number of tasks leaving the system • This flow-balanced stateis necessary but not sufficient for steady state
Steady State I/O Device • The system has reached steady state if the system has been observed for a sufficiently long time and mean waiting times stabilize
Little’s Law • Assumptions multiple independent I/O requests in equilibrium: input rate = output rate; a steady supply of tasks independent for how long they wait for service;
Little’s Law Mean number of tasks in system =Arrival ratexMean response time
Little’s Law Mean number of tasks in system =Arrival ratexMean response time applies to any system in equilibrium nothing inside the black box creating new tasks or destroying them I/O Device
Single-Server Model • Queue / Waiting line the area where the tasks accumulate, waiting to be serviced • Server the device performing the requested service is called the server
Single-Server Model • Timeserver average time to service a task average service rate: 1/Timeserver • Timequeue average time per task in the queue • Timesystem average time per task in the system, or the response time; Timequeue + Timeserver
Single-Server Model • Arrival rate average # of arriving tasks per second • Lengthserver average # of tasks in service • Lengthqueue average length of queue • Lengthsystem average # of tasks in system, Lengthserver + Lengthqueue
Server Utilization / traffic intensity • Server utilization the mean number of tasks being serviced divided by the service rate • Service rate = 1/Timeserver • Server utilization =Arrival rate x Timeserver (little’s law again)
Server Utilization • Example an I/O sys with a single disk gets on average 50 I/O requests per sec; 10 ms on avg to service an I/O request; server utilization =arrival rate x timeserver =50 x 0.01 = 0.5 = 1/2 Could handle 100 tasks/sec, but only 50
Queue Discipline • How the queue delivers tasks to server • FIFO: first in, first out Timequeue =Lengthqueuex Timeserver + Mean time to complete the task being serviced when new task arrives if server is busy
Queue • with exponential/Poisson distribution of events/requests
Lengthqueue • Example an I/O sys with a single disk gets on average 50 I/O requests per sec; 10 ms on avg to service an I/O request; Lengthqueue = =
M/M/1 Queue • M: Markov exponentially random request arrival; • M: Markov exponentially random service time • 1 single server
M/M/1 Queue assumptions • The system is in equilibrium • Interarrival times (times between two successive requests arriving) are exponentionally distributed • Infinite population model: unlimited number of sources of requests • Server starts on the next job immediately after finishing prior one • FIFO queue with unlimited length • One server only
M/M/1 Queue • Example a processor sends 40 disk I/Os per sec; exponentially distributed requests; avg service time of an older disk is 20ms; Q: 1. avg server utilization? 2. avg time spent in the queue? 3. avg response time (queuing+serv)?