Title V Compressor Stations
480 likes | 500 Vues
Health Effects Associated with Stack Chemical Emissions from NYS Natural Gas Compressor Stations: 2008- 2014 A Technical Report Prepared for the Southwest Pennsylvania Environmental Health Project D.O. Carpenter, MD and P.N . Russo Funded by the Park Foundation October 12, 2017

Title V Compressor Stations
E N D
Presentation Transcript
Health Effects Associated with Stack Chemical Emissions from NYS Natural Gas Compressor Stations: 2008-2014 A Technical Report Prepared for the Southwest Pennsylvania Environmental Health Project D.O. Carpenter, MD and P.N. Russo Funded by the Park Foundation October 12, 2017 SWPA-EHP Presentation: David Brown, ScD SujitJoginpally, MD, MBA, MPA, MAS Celia Lewis, PhD
Document Organization: What parts are most important for communities? First Sections to Read: *Letter from Raina Rippel, Director of EHP *Executive summary –Focus is on impact of total releases p 17 *Introduction p 31 Purpose of the report –details our concerns about lack of information on health impacts p 11 4 chapters in the Report: 1) Background – general information on the topic 2) Chemical releases – describes the amount of emissions by geographic impact and population impact 3) Health effects of releases – which chemicals cause which diseases 4) Health effects associated with chemicals released at each station
Executive Summary • 60 UNGD compressors in the State – 18 are Title V • Summarizes total emission releases by: • Amount - 40.2 million pounds over 7 years • Chemicals – 70 chemicals reported to NEI • Emissions Impact • by geographic area: NY region, county • by population size ( 2 to 20 mile radius) • List of 18 Disease categories associated with these chemicals • p.25
Permits and Regulations (p.81) • Air Title V permits: Point Sources: Large emitting facilities that are judged to be “major” under the department's regulations, • or that are subject to New Source Performance Standards, • and to other requirements regulating hazardous air pollutants such as federal acid rain program requirements. • State Facility permits: Nonpoint Sources: Large emitting facilities • actual emissions exceed 50% of major facilities (such as Title V) • May have been granted variances under the department's air regulations • May be new facilities that are subject to New Source Performance Standards or that emit hazardous air pollutants.
How a Person reads the Document How close is too close? What are the health implications? What are the levels of exposure?
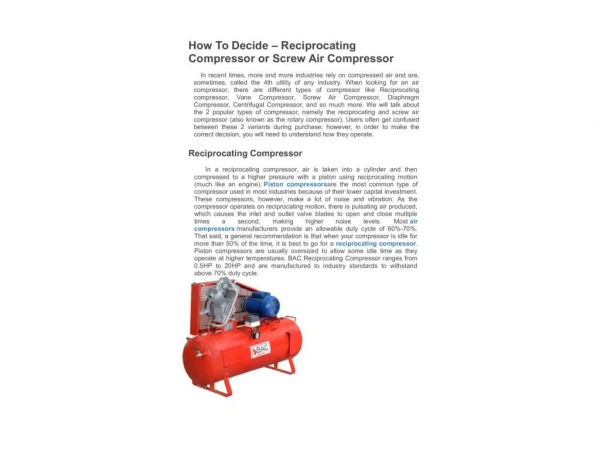
Compressors on natural gas pipelines release mixtures of chemicals • From venting of gas from pipeline • Emissions from metering devices • Emissions from burning natural gas to fuel engines
Report shows chemicals emitted and the toxic effects • Chapter 2 tables show the chemicals and amounts emitted. • 95% of emissions are involve 7 chemical classes. • Chapter 3 tables show the chemicals linked to each health effect. • Primary health effects involve the respiratory system, nervous system, circulatory system, reproduction and cancer.
Amount of emissions at each location Chapter 4 shows amount of emissions linked to specific health effects at each of the 18 locations • amounts range from a high of 1,500,000 pounds to a low of 32,000 pounds/year • 6 stations are 350,000 to 1,500,000 pounds • 6 stations are 150,000 to 350,000 pounds • 6 stations are 32,000 to 150,000 pounds
Health risk is determined by amount and the number of hours that the chemical is inhaled Hours and amount of exposure are determined by topography, distance and wind direction: • Exposure 1/2 mile from a source that emits 5 tons/year (10,000 pounds) is about; • Average 80 ug/m3 (ranging from 20 to 250ug/m3) • 25% of hours exceeds 166 ug/m3 • Exposures extend for 6 miles and vary wind direction.
Five major chemical emissions from New York Compressor stations • Nitrogen oxides (45%) • Carbon monoxide (31%) • Formaldehyde (3%) • PM 2.5 particulate matter (3%) • Volatile Organic Hydrocarbons (12%) (28 compounds)
What chemicals affect the mental and behavioral disorders ? (page 169)
Average annual pounds of chemicals released from a single facility and Health Effects 106,158 pounds of lower respiratory organ toxics. 282. 933 pounds of upper respiratory system toxics 102, 539 pounds of circulatory system toxics. 154, 887 pounds of Mental and behavioral disorders toxics Total releases 287, 639 pounds*
Three important Factors that determine intensity of health responses • Chemicals in the mixtures interact to increase intensity and frequency of health effects. • Ambient air levels vary up to 10 times over baseline 3 to 10 hours a week. • Chemicals have multiple effects and may bioaccumulate
1/2 mile east 25% of hours exceed 69 10% exceed 150 ug/m3 Yearly impact based on ambient air Model 2016 weather data North Compressor station school 300 gm/hour East West 1 mile east 25% of hours exceed 26 10% exceed 100 ug/m3 South Emission 300 gms/hour =3 tons/year or 6000 #/year
Federal and State laws and regulations are designed to protect the general health of regional populations and not to protect a single group of locally exposed persons.
Regulations set to minimize health impact makes three critical and questionable assumptions: • Individual Chemicals vs. Mixed Chemicals: • 31 chemicals associated with circulatory diseases like heart attacks and strokes.
Exposure to Multiple Chemicals with Similar Health Effects Chemical 1 Chemical 2 Chemical 3 Cardiovascular Effects Cardiovascular effects Cardiovascular effects • -The effect of being exposed to multiple carcinogens is not considered in EPA or DEC regulations
Average vs. Acute exposures: • EPA guideline assumes exposures from a facility occur evenly over time. • In reality, chemicals released from facilities fluctuate widely. During times of peak exposures the individuals living or present near the compressor sites may get exposed to high concentrations, way above federal and state guidelines that consider safe.
Healthy vs. health compromised or particularly vulnerable populations: - With few exceptions, EPA and DEC guidelines assumes everyone at equal risk. - Populations at greater risk: Infants, elderly, immune-compromised individuals, and individuals with pre-existing conditions like COPD, Asthma, Congestive heart disease and other debilitating disorders.
Conceptual Model of Exposure Pathways • Transport Medium • Exposure Point • Exposure Route • Exposed Population Adopted from Indiana Department of Environmental Management
Five major Chemical emissions from New York Compressor stations
Major Chemicals released from Title V Compressor Stations • NO2 • Sources: cars, trucks, power plants, off road equipment and compressor stations. • Health effects: • Short term: irritate airways, can aggravate respiratory diseases, particularly asthma and may lead to coughing, wheezing or difficulty breathing. • Longer exposures: Development of asthma and increase susceptibility to respiratory infections. • CO • Sources: Cars, trucks, gas stoves, compressor stations, etc., • Health effects: • Replaces O2 on Hemoglobin -> decrease O2 to brain and heart • High levels, possibly indoors, -> dizziness, confusion, unconsciousness and death • Very high levels: Less likely outdoors, however elevated outdoor CO levels concerning for people with heart disease. • VOC’s: • Health effects -> Eyes, nose and throat irritation, headaches and nausea, damage to liver, kidney and CNS. Some are known to cause to cause cancer in humans. • Key signs or symptoms associated with exposure to VOCs include: Conjunctival irritation, nose and throat discomfort, headache, allergic skin reaction, dyspnea, decline in serum cholinesterase levels, nausea, epistaxis, fatigue and dizziness. • Formaldehyde: • Short term health effects: levels exceeding 0.1 ppm. Watery eyes, burning sensation in eyes, nose and throat, cough, wheezing, nausea and skin irritation. EPAclassified formaldehyde as a probable carcinogen at high or prolonged exposure.
A serious synergistic toxic actionFine particles increase transport of toxics into deep lung According to US Agency for Toxic Substances and Disease Registry(ATSDR) Short term exposures: Exposure to maximum levels of PM2.5 may be harmful to unusually sensitive populations, such as those with respiratory or heart disease, but are not at levels that are a concern to the general population. Chronic exposures: The estimated annual average PM2.5 concentration of 15 to 16 μg/ may be harmful to the general population and sensitive subpopulations, including the elderly, children, and those with respiratory or heart disease.
Major Health Effects • Respiratory problems • Skin irritation • Cardiovascular • Neurological • Anxiety, stress and sleep deprivation • Long term health issues: Maybe Cancer
What should you tell your physician/healthcare provider? • Full description of your symptoms if they are related to chemicals released from CS • Proximity of compressor station to your home/work • Provide information on types of chemicals released from CS. • Inform if they are more than one person in your family with similar symptoms.
Education Tools for Physicians/Healthcare Providers • Medical Toolkit for Healthcare Providers http://www.environmentalhealthproject.org/healthcare-providers/medical-toolbox • Environmental Health Channel http://envhealthchannel.org/
Education Tools for Communities • Citizen Science Toolkit http://environmentalhealthproject.org/citizen-science-toolkit • Health Effects Registry http://environmentalhealthproject.org/health-effect-registry • Environmental Health Channel http://envhealthchannel.org/ • EHP Factsheets, technical papers, and other resources http://www.environmentalhealthproject.org/resources/research-factsheets
For More Information www.environmentalhealthproject.org 724.260.5504 info@environmentalhealthproject.org
Five major chemical emissions from New York Compressor stations • Nitrogen oxides (45%) health value 1.8 mg/m3 • Carbon monoxide (31%) health value 40 mg/m3 • Formaldehyde (3%) health value 19 ug/m3 • PM 2.5 particulate matter (3%) health value 15 ug/m3 • Volatile Organic Hydrocarbons (12%) (28 compounds) • Health value 19 ug/m3 based on BTX • Health values based on federal workplace standards