Data Attributes in Data Mining
Learn about attributes and objects in data, different types of attributes, attribute transformation, discrete vs. continuous attributes, data sets, data quality issues, and handling missing values in data mining.


Data Attributes in Data Mining
E N D
Presentation Transcript
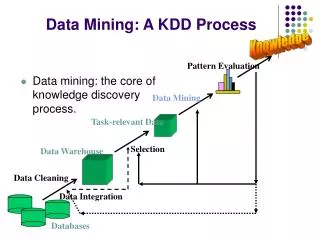
Data Mining: Data Lecture Notes for Chapter 2 Introduction to Data Mining by Tan, Steinbach, Kumar (edited by S. Parthasarathy 3/2007)
What is Data? • Collection of data objects and their attributes • An attribute is a property or characteristic of an object • Examples: eye color of a person, temperature, etc. • Attribute is also known as variable, field, characteristic, or feature • A collection of attributes describe an object or a record • Object is also known as record, point, case, sample, entity, or instance Attributes Objects
Attribute Values • Attribute values are numbers or symbols assigned to an attribute • Distinction between attributes and attribute values • Same attribute can be mapped to different attribute values • Example: height can be measured in feet or meters • Different attributes can be mapped to the same set of values • Example: Attribute values for ID and age are integers • But properties of attribute values can be different • ID has no limit but age has a maximum and minimum value
Types of Attributes • There are different types of attributes • Nominal • Examples: ID numbers, eye color, zip codes • Ordinal • Examples: rankings (e.g., taste of potato chips on a scale from 1-10), grades, height in {tall, medium, short} • Interval • Examples: calendar dates • Ratio • Examples: length, time, counts
Attribute Level Transformation Comments Nominal Any permutation of values If all employee ID numbers were reassigned, would it make any difference? Ordinal An order preserving change of values, i.e., new_value = f(old_value) where f is a monotonic function. An attribute encompassing the notion of good, better best can be represented equally well by the values {1, 2, 3} or by { 0.5, 1, 10}. Interval new_value =a * old_value + b where a and b are constants Calendar dates can be converted – financial vs. gregorian etc. Ratio new_value = a * old_value Length can be measured in meters or feet.
Discrete and Continuous Attributes • Discrete Attribute • Has only a finite or countably infinite set of values • Examples: zip codes, counts, or the set of words in a collection of documents • Often represented as integer variables. • Note: binary attributes are a special case of discrete attributes • Continuous Attribute • Has real numbers as attribute values • Examples: temperature, height, or weight. • Practically, real values can only be measured and represented using a finite number of digits. • Continuous attributes are typically represented as floating-point variables.
Types of data sets • Record • Data Matrix • Distance Matrix • Document Data • Transaction Data • Graph • World Wide Web • Molecular Structures • Ordered • Spatial Data • Temporal Data • Sequential Data • Genetic Sequence Data
Record Data • Data that consists of a collection of records, each of which consists of a fixed set of attributes
Data Matrix • If data objects have the same fixed set of numeric attributes, then the data objects can be thought of as points in a multi-dimensional space, where each dimension represents a distinct attribute • Such data set can be represented by an m by n matrix, where there are m rows, one for each object, and n columns, one for each attribute
Data Matrix Example for Documents • Each document becomes a `term' vector, • each term is a component (attribute) of the vector, • the value of each component is the number of times the corresponding term occurs in the document.
Distance Matrix Distance Matrix
Transaction Data • A special type of record data, where • each record (transaction) involves a set of items. • For example, consider a grocery store. The set of products purchased by a customer during one shopping trip constitute a transaction, while the individual products that were purchased are the items.
Graph Data • Examples: Generic graph – how can we create this? (hint: think about a distance matrix) 2 1 5 2 5
Data Quality • What kinds of data quality problems? • How can we detect problems with the data? • What can we do about these problems? • Examples of data quality problems: • Noise and outliers • missing values • duplicate data
Two Sine Waves Two Sine Waves + Noise Frequency Plot (FFT) Noise • Noise refers to modification of original values • Examples: distortion of a person’s voice when talking on a poor phone and “snow” on television screen
Outliers • Outliers are data objects with characteristics that are considerably different than most of the other data objects in the data set
Missing Values • Reasons for missing values • Information is not collected (e.g., people decline to give their age and weight) • Attributes may not be applicable to all cases (e.g., annual income is not applicable to children) • Handling missing values • Eliminate Data Objects • Estimate Missing Values • Ignore the Missing Value During Analysis • Replace with all possible values (weighted by their probabilities)
Duplicate Data • Data set may include data objects that are duplicates, or almost duplicates of one another • Major issue when merging data from heterogeous sources • Examples: • Same person with multiple email addresses • Data cleaning • Process of dealing with duplicate data issues
Data Preprocessing • Standardization or Normalization • Aggregation • Sampling • Dimensionality Reduction • Feature subset selection • Discretization and Binarization • Attribute Transformation
Data Transformations targeted at minimizing experimental variance • Normalization: scaled to fall within a small, specified range • min-max normalization • z-score normalization • normalization by decimal scaling • Centralization: • Based on fitting a distribution to the data • Distance function between distributions • KL Distance • Mean Centering
Data Transformation: Normalization • min-max normalization • z-score normalization • normalization by decimal scaling Where j is the smallest integer such that Max(| |)<1
Aggregation • Combining two or more attributes (or objects) into a single attribute (or object) • Purpose • Data reduction • Reduce the number of attributes or objects • Change of scale • Cities aggregated into regions, states, countries, etc • More “stable” data • Aggregated data tends to have less variability
Sampling • Sampling is the main technique employed for data selection. • It is often used for both the preliminary investigation of the data and the final data analysis. • Statisticians sample because obtaining the entire set of data of interest is too expensive or time consuming. • Sampling is used in data mining because processing the entire set of data of interest is too expensive or time consuming.
Sampling … • The key principle for effective sampling is the following: • using a sample will work almost as well as using the entire data sets, if the sample is representative • A sample is representative if it has approximately the same property (of interest) as the original set of data
Types of Sampling • Simple Random Sampling • There is an equal probability of selecting any particular item • Sampling without replacement • As each item is selected, it is removed from the population • Sampling with replacement • Objects are not removed from the population as they are selected for the sample. • In sampling with replacement, the same object can be picked up more than once • Stratified sampling • Split the data into several partitions; then draw random samples from each partition
Sample Size 8000 points 2000 Points 500 Points
Sample Size • What sample size is necessary to get at least one object from each of 10 groups. • Learning Curve
Dimensionality Reduction • Why? • When dimensionality increases, data becomes increasingly sparse in the space that it occupies • Definitions of density and distance between points, which is critical for clustering and outlier detection, become less meaningful • Objectives: • Avoid curse of dimensionality • Reduce amount of time and memory required by data mining algorithms • Allow data to be more easily visualized • May help to eliminate irrelevant features or reduce noise • Techniques • Principle Component Analysis or Singular Value Decomposition • Others: supervised and non-linear techniques
x2 e x1 Principal Components Analysis: Intuition • Goal is to find a projection that captures the largest amount of variation in data • Find the eigenvectors of the covariance matrix • The eigenvectors define the new space
Principal Component Analysis: Details • Let A be an n ×n matrix representing the correlation or covariance of the data. • λ is an eigenvalue of A if there exists a non-zero vector v such that: Av = λv often rewritten as (A- λI)v=0 • In this case, vector v is called an eigenvector of A corresponding to λ. For each eigenvalue λ, the set of all vectors v satisfying Av = λv is called the eigenspace of A corresponding to λ.
Feature Subset Selection • Another way to reduce dimensionality of data • Redundant features • duplicate much or all of the information contained in one or more other attributes • Example: purchase price of a product and the amount of sales tax paid • Irrelevant features • contain no information that is useful for the data mining task at hand • Example: students' ID is often irrelevant to the task of predicting students' GPA
Simple Discretization Methods: Binning • Equal-width (distance) partitioning: • Divides the range into N intervals of equal size: uniform grid • if A and B are the lowest and highest values of the attribute, the width of intervals will be: W = (B –A)/N. • The most straightforward, but outliers may dominate presentation • Skewed data is not handled well. • Equal-depth (frequency) partitioning: • Divides the range into N intervals, each containing approximately same number of samples • Good data scaling • Managing categorical attributes can be tricky.
Information/Entropy • Given probabilitites p1, p2, .., ps whose sum is 1, Entropyis defined as: • Entropy measures the amount of randomness or surprise or uncertainty. • Only takes into account non-zero probabilities
Entropy-Based Discretization • Given a set of samples S, if S is partitioned into two intervals S1 and S2 using boundary T, the entropy after partitioning is • The boundary that minimizes the entropy function over all possible boundaries is selected as a binary discretization. • The process is recursively applied to partitions obtained until some stopping criterion is met, e.g., • Experiments show that it may reduce data size and improve classification accuracy
Distance Metrics Revisited:Minkowski Distance • Minkowski Distance is a generalization of Euclidean Distance Where r is a parameter, n is the number of dimensions (attributes) and pk and qk are, respectively, the kth attributes (components) or data objects p and q. • Eucledian and Manhattan are specializations of this metric (r=2 or 1 respectively)
Mahalanobis Distance is the covariance matrix of the input data X For red points, the Euclidean distance is 14.7, Mahalanobis distance is 6.
Mahalanobis Distance Example (work this out yourselves) Covariance Matrix: C A: (0.5, 0.5) B: (0, 1) C: (1.5, 1.5) Mahal(A,B) = 5 Mahal(A,C) = 4 B A
Common Properties of a Distance • Distances, such as the Euclidean distance, have some well known properties. • d(p, q) 0 for all p and q and d(p, q) = 0 only if p= q. (Positive definiteness) • d(p, q) = d(q, p) for all p and q. (Symmetry) • d(p, r) d(p, q) + d(q, r) for all points p, q, and r. (Triangle Inequality) where d(p, q) is the distance (dissimilarity) between points (data objects), p and q. • A distance that satisfies these properties is a metric
Common Properties of a Similarity • Similarities, also have some well known properties. • s(p, q) = 1 (or maximum similarity) only if p= q. • s(p, q) = s(q, p) for all p and q. (Symmetry) where s(p, q) is the similarity between points (data objects), p and q.
Density • Density-based clustering require a notion of density • Examples: • Euclidean density • Euclidean density = number of points per unit volume • Probability density • Graph-based density
Euclidean Density – Cell-based • Simplest approach is to divide region into a number of rectangular cells of equal volume and define density as # of points the cell contains
Euclidean Density – Center-based • Euclidean density is the number of points within a specified radius of the point