Download

1 / 16
160 likes | 287 Vues
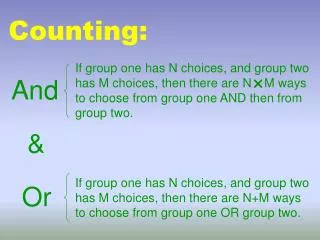
Counting and not counting for the community college. Pieces of the background tapestry for judging “graduation rates” Cliff Adelman, Institute for Higher Education Policy. Who is/is not counted, I: proportion entering in the fall term. Who is/is not counted, II: the part-time factor.

E N D
Counting and not counting for the community college Pieces of the background tapestry for judging “graduation rates” Cliff Adelman, Institute for Higher Education Policy
Who is/is not counted, I: proportion entering in the fall term
Relationship of season of entrance to part-time experience in 1st calendar year
What happens to traditional-age community college beginners if everyone is counted?
The sum puts community college “success” rates at 43 percent The data are NELS, so that’s an 8.5 year measure and a traditional-age cohort
Your daughter v. your brother-in-law: a visit with CC beginners in BPS96
They do live on different planets, don’t they? And lumping them together distorts the story-line, no?
Attendance pattern features influencing completion and temporal boundaries
Other data notations on traditional-age community college beginners • Eligible for AA/AAS but not awarded 1.4% • Ave. elapsed time to associate’s 3.59 (S.D. = 1.85) with 8.5 year maximum • Transfer rate for those with >1 course 29% • Transfer rate for those with >10 creds 36% • Proportion of status drop-outs who had been placed on academic probation or dismissed for academic reasons at any time 24%
Primary reason for non-completion given by community college status drop-outs • Personal / family 35% • Job / military 19 • Mood / lifestyle 19 • Financial 18 • Academic 6 • Other 2
What do we conclude from all this? • The current GRS covers about 1/3rd of traditional-age community college beginners • The 150% TTD marker bears no resemblance to empirical behavior • Older beginning students track radically different records than traditional-age students. • No matter what they say, we have a significant portion of community college students with serious academic problems and loose commitments to education
Telling an honest story without Unit Records: changing the GRS formula • Define an academic calendar year, and establish 3 tracking cohorts within that year • The first 2 tracking cohorts divide BPS students by age—keeping it simple---and require a minimum of 6 credits (of any kind) in 1st term of attendance, thus excluding incidental students and de facto visitors and tourists • The 3rd cohort consists of transfers-in. • Completion rates for the 3 cohorts reported separately • A 4th bin for “good faith effort” accounts for all who did not complete with the reporting institution
Community college reporting bins For each of two age groups (bins 1 and 2): transferred to a 4-year institution no transfer, but Associate’s degree no transfer, but Certificate For transfers in (bin 3) Ave. transfer credits accepted Associate’s degree Certificate “Good Faith Hunting” for residuals in each of the two age groups (bins 1 and 2): Left, not located Left, transferred to another 2-year
What do we get? • Part-timers, but not incidentals • Transfers-in • Your brother-in-law distinguished from your daughter • Realistic two-stop temporal frames • Single reporting date for both tracking cohorts and completions / locatings 90 percent of the universe, compared with 50 percent now. But don’t expect completion rates to increase.