Download
1 / 62
620 likes | 743 Vues
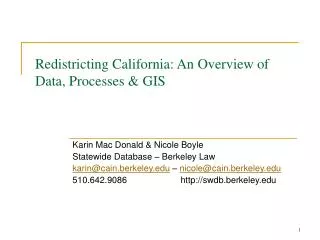
Redistricting California: An Overview of Data, Processes & GIS. Karin Mac Donald & Nicole Boyle Statewide Database – Berkeley Law karin@cain.berkeley.edu – nicole@cain.berkeley.edu 510.642.9086 http://swdb.berkeley.edu. Who we are and what we will do today:.

E N D
Redistricting California: An Overview of Data, Processes & GIS Karin Mac Donald & Nicole Boyle Statewide Database – Berkeley Law karin@cain.berkeley.edu – nicole@cain.berkeley.edu 510.642.9086 http://swdb.berkeley.edu
Who we are and what we will do today: • Karin’s and Nicole’s redistricting experience • Statewide Database: Redistricting Database for the State of California – http://swdb.berkeley.edu • Overview of this session: • Review the task of selecting 6 additional commissioners • Introduce Data used in Redistricting • Live Demo on moving lines and how districts are constructed • Practical considerations re: public input and the process in general • Questions & Answers
Criteria on which the remaining 6 commissioners shall be selected: • The six appointees shall be chosen to ensure the commission reflects this state's diversity, including, but not limited to, racial, ethnic, geographic, and gender diversity. However, it is not intended that formulas or specific ratios be applied for this purpose. Applicants shall also be chosen based on relevant analytical skills and ability to be impartial. (legal guide p 7/8) • Analytical Skills – includes ability to understand technical materials incl. maps and statistical info; resolve complex problems • Ability to be impartial – includes ability to evaluate information with an open mind; make decisions that set aside personal views/interests
CA Demographic* & Current Commission Breakdown *2009 ACS 1 yr. estimate
Reflecting the State’s diversity: why is it important? • Appearances matter! • Experience working with diverse communities • Increases collective knowledge of State’s geography and uniqueness • Brings different voices to the commission
…moving on to Data in Redistricting! • Which data are used to draw lines? • Which data are used for which criterion? • Which data are easily accessible? • Which ones are not? • Which data sources are available but difficult (or impossible?) to use?
Redistricting Criteria andData used: Equal Population – PL94-171 Compliance with Federal Law (VRA) – PL94-171, SOR, SOV Compactness – Census Geography Contiguity – Census Geography Respect for City and County boundaries – Census Geography Respect for Neighborhoods – Public Testimony, Data/Geography submitted by Public, Cities/Counties, etc. Respect for Communities of Interest – Public Testimony, Data/Geography submitted by Public
Equal Population • That’s why we do it! • Constitutional requirement • One person, One vote • 14th Amendment: Equal protection clause • How equal is equal???
How equal is equal? Part I: Congress • Strict population equality in CDs • No Deviation is too small to worry about • (if it could have been avoided) • Translation: 28 States’ CDs had total deviation of less than 10 people after 2000 round of redistricting!
How equal is equal? Part II – Legislative Districts • Total deviation within 10% may not constitute a ‘prima facie equal protection violation under the 14th Amendment’ • Gaffney v Cummings 1973 • Above 10%: be ready to justify with “substantial and legitimate state interest’ • Example: preservation of county boundaries • Larios v Cox, 2004: Legislature believed that w/in +/-5% is ‘safe harbor’ – not necessarily!
Census 2000 used 2 forms: 1. The “short” form – asked for basic demographic and housing information, i.e. age, sex, race, ethnicity, # of people in housing unit, renter/owner EVERY HOUSEHOLD RECEIVED THIS FORM 2. The “long” form – collected the same information as the short form plus income, education, citizenship, language spoken at home, etc. ONE IN SIX HOUSEHOLDS RECEIVED THIS FORM Long form data aka “sample data.” Short form data aka “100 percent data” (or 100%sample) 2000 Decennial Census
2010 Decennial Census and American Community Survey (ACS) What’s New? 2010 Census used only the “short” form. The sample data are now collected by the ACS instead of the “long” form. What’s Old? Short form data must be released by the Census bureau before April 1, 2011, one year following Census day
2010 Decennial Census PL94-171 Data -Basic Information/ Data that jurisdictions are required by law to use for Redistricting-Census 2010 Redistricting Data (Public Law 94-171, or "PL94") contains the count of the U.S. population -Is a BLOCK-LEVEL dataset -Includes data on people's race and ethnicity, for both the total and the voting age population- Information is based on answers to the questions in the Census 2010 Short-Form questionnaire.-There are 5 detailed tables available in the PL94-171 data product.
Subject Table #RaceTotal population . . . . . . . . . . . . . . . . . . . . . . . . . . . . . . . . . . . . . . . . . . . . . . . . . . . . . . . . . . . . . . . . . . . . . P1Hispanic or Latino, and Not Hispanic or Latino by RaceTotal population . . . . . . . . . . . . . . . . . . . . . . . . . . . . . . . . . . . . . . . . . . . . . . . . . . . . . . . . . . . . . . . . . . . . . . P2Race for the Population 18 Years and OverTotal population 18 years and over . . . . . . . . . . . . . . . . . . . . . . . . . . . . . . . . . . . . . . .. . . . . . . . . . . . . . . . .P3Hispanic or Latino, and Not Hispanic or Latino by Race for the Population 18 Years and OverTotal population 18 years and over . . . . . . . . . . . . . . . . . . . . . . . . . . . . . . . . . . . . . . . . . . . . .. . . . . . . . . . .P4Occupancy StatusHousing units . . . . . . . . . . . . . . . . . . . . . . . . . . . . . . . . . . . . . . . . . . . . . . . . . . . . . . . . . . . . . . . . . . . . . . . . H1 2010 Decennial Census PL94 Data Summary Tables
P1. RaceUniverse: Total populationTotal: Population of one race: White alone Black or African American alone American Indian and Alaska Native alone Asian alone Native Hawaiian and Other Pacific Islander alone Some other race aloneRepeats for the Population of two or more races…..P2.Hispanic or Latino, and Not Hispanic or Latino by RaceUniverse: Total populationTotal: Hispanic or Latino Not Hispanic or Latino: Population of one race: White alone Black or African American alone American Indian and Alaska Native alone Asian alone Native Hawaiian and Other Pacific Islander alone Some other race aloneRepeats for the Population of two or more races….. 2010 PL94 Data Summary Table Subject Layout
2010 PL94 Data Summary Table Subject Layout P3. Race For The Population 18 Years and Over P1 variables are repeated for the Population 18 Years and OverP4. Hispanic or Latino, and Not Hispanic or Latino By Race For The Population 18 Years And Over P2 variables are repeated for the Population 18 Years and OverH1. Occupancy StatusUniverse: Housing unitsTotal: Occupied Vacant
2010 Census and American Community Survey (ACS) nationwide survey that replaces the long-form collects same information on people and housing as the long-form questionnaire used in Census 2000. is an on-going survey versus data released on PL94-171, which are collected on “census day” (April 1, 2010) is released in “multi-year estimates” on census block-group level The ACS does NOT release data on the census block level! Detailed demographic, social, economic, and housing data are no longer collected as part of the decennial census. ACS data can be grouped into four main types of characteristics – social, economic, housing, and demographic 19 19
American Community Survey Demographic Characteristics Sex Age Race Ethnicity 20 20
American Community SurveySocial Characteristics Education Marital Status Fertility Grandparent Caregivers Citizenship Veteran Status Disability Status • Place of Birth • Citizenship • Year of Entry • Language Spoken at Home • Ancestry / Tribal • Affiliation 21 21
American Community Survey Economic Characteristics Income Benefits Employment Status Occupation Industry Commuting to Work Place of Work 22 22
American Community Survey Housing Characteristics Tenure Occupancy & Structure Housing Value Taxes & Insurance Utilities Mortgage/Monthly Rent And our personal favourite: PLUMBING! 23 23
American Community Survey Data Products Release Schedule * Five-year estimates will be available for areas as small as census tracts and block groups. Source: US Census Bureau 24 24
District Building Blocks: U.S. Census Geography - Blocks: smallest ‘unit of analysis’ on which data are reported” - Block groups - Tracts - Places (cities) - Counties - State
Alameda County, California 2000 Census Tracts (321 tracts in county)
Alameda County, California 2000 Census Block Groups (983 block groups in county)
Alameda County, California 2000 Census Blocks (14,931 blocks in county)
Alameda County, California 2000 Census Block Groups in Tract 435101
Alameda County, California 2000 Census Blocks in Tract 435101
PL94 Data are Tabulated and Reported for All Geographic Entities PL94 Data are Tabulated and Reported for All Geographic Entities
U.S. Census Bureau TIGER/LineTopologically Integrated Geographic Encoding and Referencing system 1990 TIGER/ Line 58 Counties 471 Census Places/ Cities 5,874 Census Tracts 21,554 Census Block Groups 400,414 Census Blocks 2000 TIGER/ Line 58 Counties 1,018 Census Places/ Cities 7,049 Census Tracts 22,133 Census Block Groups 533,163 Census Blocks 2010 TIGER/Line 58 Counties ? Census Places/ Cities ? Census Tracts ? Census Block Groups 710,145 Census Blocks
Election Data! Why are those needed??? Voting Rights Act: Sections 2 & 5 Section 2 – Majority Minority Districts ->Minority group must be large enough to constitute a majority in the district (50%+) ->Minority group must be geographically compact ->Minority group votes cohesively ->There must be evidence of polarized voting against the minority group NOTE: Sec 2 does NOT prohibit the drawing of “influence seats” nor considering racial/ethnic Communities of Interest Section 5 – Preclearance and Retrogression -> Kings, Merced, Monterey, Yuba
Electoral Geography Precincts -Smallest unit of analysis for reporting of electoral data. -Many precincts change with each election Electoral geography that must be redistricted: -Assembly, Senate, and Congressional districts -City Council and County Board of Supervisor districts -Board of Equalization districts -County Hospital Board of Trustees districts, Community College districts, Water districts, Transportation districts, Mosquito Abatement districts, etc.
2008 California General Election 62,404 Precincts in the State
Alameda County, California 2008 General Election Precincts (1,504 in county)
Alameda County, California 2008G Precincts that are contained or partially contained in 2000 Census Tract 435101
Alameda County, California Census Block 1000 with transecting 2008G precincts
Data and reporting geography • Pl94-171 • Census block (constant for 10 years) • Statements of Vote (SoV) • Voting precinct (frequent changes) • Statements of Registration (SoR) • Registration files: individual level data
SoV & SoR • SoV variables: • Total Vote • Votes for Races and Propositions • SoR variables: • Total Registration • Party ID • Sex/Gender • Age • Cycles Registered • Race/Ethnicity – surname matched
Data Complexities: • Task: build dataset comparable on same unit of analysis over time … available for redistricting (2011) • Why is this difficult? • Election results reporting geography changes frequently (precincts) • What’s the solution? • Answer: census blocks
The Statewide Database • The State of California’s Redistricting Database • History • Data Collection: • Census • Registrars of Voters/County Clerks
Why are we talking about the Statewide Database? • (b) The Legislature shall take all steps necessary to ensure that a complete and accurate computerized database is available for redistricting, and that procedures are in place to provide the public ready access to redistricting data and computer software for drawing maps. Upon the commission's formation and until its dissolution, the Legislature shall coordinate these efforts with the commission.
A Quick Overview of the Statewide Database (SWDB) The Database includes: I. Census & Electoral Data II. Census & Electoral Geography III. Conversion files IV. Data Reports & Maps V. Redistricting & Census News and Court case archive VI Redistricting Research http://swdb.berkeley.edu
Redistricting Criteria andData used: Equal Population – PL94-171 Compliance with Federal Law (VRA) – PL94-171, SOR, SOV Compactness – Census Geography Contiguity – Census Geography Respect for City and County boundaries – Census Geography Respect for Neighborhoods – Public Testimony, Data/Geography submitted by Public, Cities/Counties, etc. Respect for Communities of Interest – Public Testimony, Data/Geography submitted by Public
Criteria for which data are not easily available: • Communities of Interest: • What is a Community of Interest? It depends… • Group of people with specific common interest (“actual shared interests” Miller v Johnson, 1995) • Can be defined geographically • What are they NOT? • In CA: Communities of interest shall not include relationships • with political parties, incumbents, or political candidates • Neighborhoods: • Vary in size • Are sometimes defined by cities (often poorly), and/or communities • No data sources available that show neighborhoods statewide • Need to be documented and submitted
CA’s new definition of ‘community of interest’ ‘A community of interest is a contiguous population which shares common social and economic interests that should be included within a single district for purposes of its effective and fair representation. Examples of such shared interests are those common to an urban area, a rural area, an industrial area, or an agricultural area, and those common to areas in which the people share similar living standards, use the same transportation facilities, have similar work opportunities, or have access to the same media of communication relevant to the election process.’