Download
1 / 20
200 likes | 295 Vues
Explore ongoing climate research at TERI, focusing on quantified uncertainty measures, regional processes enclosure, and downscaled information for improved impacts assessments. Gain insights into crucial advancements in Earth science models.

E N D
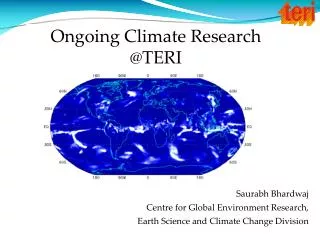
Ongoing Climate Research @TERI Saurabh Bhardwaj Centre for Global Environment Research, Earth Science and Climate Change Division
Outline of the talk • Background • Three forked formulation to follow • Process models • Resources at TERI • Goals
Three forked formulation Quantified uncertainty measures Enclosure of regional processes Downscaled information for better impacts assessments Quod Erat Demonstrandum
Fork I: Quantified uncertainity measures Observational Importance: The high resolution availability of both spatial and temporal data is required to quantify address the uncertainity in models: • All the states do not have equal number of meteorological stations • The observations of other variables (like temperature, windspeed and radiation variables) are available only at selected stations for a long period
Fork II: Enclosure of regional processes Early climate models as we know started at Mid-1970s Since then each decade the improvement of including local processes have become very essential Presently, we are moving towards a Global Earth System Model which can include the regional processes, however what spatial scale the model should use is an issue. Better representation of the regional processes are essential to resolve the climatic variability It has been found, over Asia, the three significant physical processes are (Source: Congbin Fu, 2002) Land use and land cover changes and vegetation, Aerosol forcing, Oceanic transport of heat Hence inclusion of Earth system processes becomes essential in models
Fork III: Downscaled information for better impacts assessments Improvements in Grid resolution • The evaluation of the Climate models has become an essential pre-requisite to understand the Earth’s climate system • A Model Intercomparison Project is an approach to model verification and they are part of community analysis and verification/activity. • Intergovernmental Panel for Climate Change has started its MIP programs with Atmospheric Models in 1995 till today with CMIP (Coupled Ocean Atmospheric Models).
Regional Downscaling Model • PRECIS (Providing Regional Climate for Impact Studies) for Impact Assessment studies over Indian region • PRECIS is a dynamical downscaling tool • To run the model, lateral and surface boundary conditions- HadAM3 (3.75x2.5 deg) • Experiment conducted:Base line (1961-90), A2 & B2 (2071-2100) • Study Domain50-380N, 650-1000E • Horizontal Surface resolutions 0.440~50km • Vertical resolution19levels (Surface to the top of the atmosphere)
A2 The A2 scenarios are of a more divided world. The A2 family of scenarios is characterized by: • A world of independently operating, self-reliant nations. • Continuously increasing population. • Regionally oriented economic development. • Slower and more fragmented technological changes and improvements to per capita income. B2 The B2 scenarios are of a world more divided, but more ecologically friendly. The B2 scenarios are characterized by: • Continuously increasing population, but at a slower rate than in A2. • Emphasis on local rather than global solutions to economic, social and environmental stability. • Intermediate levels of economic development. • Less rapid and more fragmented technological change than in A1 and B1.
Mean Monsoon Pattern in PRECIS baseline simulation It is able to capture the major features but overestimates the rainfall in few regions - over Himalayan belt, few parts of central India and west coast. WRF lecture series, Bergen Norway
Extreme - scenario Moderate-scenario WRF lecture series, Bergen Norway
Annual Mean Temperature Climatology Comparison for IMD and PRECIS The overall pattern of the temperature is well captured by PRECIS over South Indian region, however over the Central and North Indian region there is negative bias of reduced temperature in model when compared to observation. WRF lecture series, Bergen Norway
Extreme-scenario Moderate-scenario WRF lecture series, Bergen Norway
Details of the Super Computing Facility • Wipro Supernova SN2007A • 128 Cores of Intel Xeon 2.83 GHz with 1333 MHz FSB • 128 Gb ddr2 667 FBDIMM RAM • 20 Gb ps Infiniband Connectivity • 16 TB Local Parallel File Storage • IPMI based advanced management tools for inband and outband management support • Redundant 20 Gb ps DDR infiniband Switching • 1Gb ps Ethernet for management • Debian GNU/Linux stable distribution with WIPRO’s enhancement as the operating system • Gluster software • Linpack performance per 1U Twin server (2 dual CPU Server in 1U space) -181.12 G Flop/s • Total Peak Performance for the system-1448.96 GFlop/s • Project Maximum Performance of the system-1014 GFlop/s
Global Climate Simulations @ TERI: an Initiative GOALS: • To enhance the climate modeling activities at TERI. • To address the key important issues in the climate system models (for ex: the tele connection patterns, the monsoon simulation over the South-Asian region etc.) • Determine the climate tipping points with the help of climate change simulations and thenceforth influence on the impacts on different sectors. • Global Coupled Climate System Model • We are presently using Community Climate System Model Version 3 for Global Climate Simulations.
Model Used: • Community Climate System Model Version 3 from the National Centre for Atmospheric Research. • The model is a coupled climate system model which is comprised of • atmospheric model (Community Atmosphere Model version 3.0), • ocean model (Parallel Ocean Program, version 1.0), • land model (Community Land model version 3.0), and • sea ice model (Community Sea Ice Model 3.0). • a coupler which acts as the main link between the sub models. • Test run simulation details • CCSM3 simulation is being performed for 100 years of which 2 years simulation results are presented here, the qualitative assessment would be done after performing the 100year simulation. • Details of the testrun • T42 resolution (300km x 300km) horizontal and 26 levels in vertical for atmosphere, • POP model with (110kmx110km) horizontal resolution and 40 levels in vertical.
Way Forward • We are planning to conduct a longer run of 100 years of control and 100 years of future with different SRES scenarios.