Download

1 / 37
370 likes | 593 Vues
Building Environment Research & Education. AgAirQuality.com. Odor and H2S Emissions from Laying House Teng-Teeh Lim, Albert J. Heber, Ji-Qin Ni. Agricultural and Biological Engineering Purdue University. New Laying Houses (2000). 1 of 14 barns 2 million bird total capacity

E N D
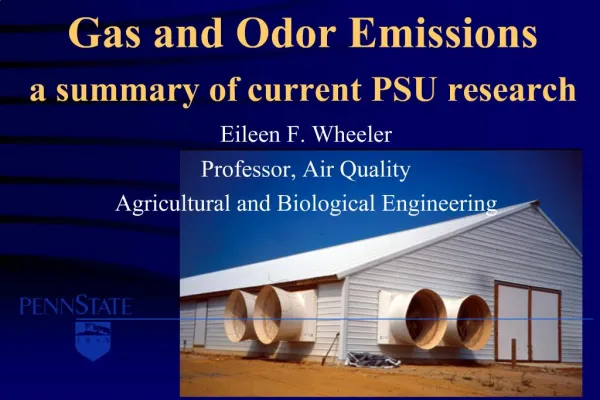
Building Environment Research & Education AgAirQuality.com Odor and H2S Emissions from Laying HouseTeng-Teeh Lim, Albert J. Heber, Ji-Qin Ni Agricultural and Biological Engineering Purdue University
New Laying Houses (2000) • 1 of 14 barns • 2 million bird total capacity • 37 m wide and 183 m long • 246,000 birds in cages.
The Laying House 246,000 hens 76 exhaust fans 73, 122-cm fans 37 m x 183 m house Ceiling inlets 10 rows of hens Under cage slot Fan inlets Stage 1: 4 fans Stage 2: 5 fans Stages 3-6: 9 fans Stage 7: 15 fans Stage 8: 13 fans Stored litter
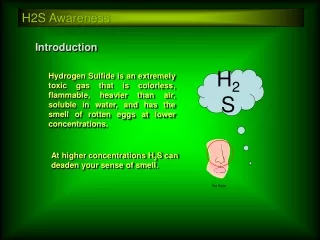
Instrument Shelter ISU module • Instrument space, protection and security • Key to quality assurance • Analyst comfort • Mobile TEOM controllers CO2 analyzer NH3 analyzer GSS Calibration gases H2S analyzer Pulsed flourescence (convert H2S to SO2)
Side view Attic Cages Pit Instrument shelter Cages End view Pit Vane anemometer AD592 temperature sensors To instrument shelter RH/temp probe Air sampling locations Static pressure port 3 4 10 Mixing manifold 11 Air inlet group Floor plan (186 m x 30 m) Exhaust air locations 1 2 Instrument shelter N Hall
Monitoring Plan at Laying House Hydrogen sulfide emission = k * 186 m3/s x 414*(17 – 2)/(273+20) = 340 g/d
Probe manifold Exhaust Sampling bag Sample lines Analyzer 1.0 L/min M3 H2S M4 F4 P2 Analyzer manifold 3.6 L/min Solenoid valves
AC’SCENT International Olfactometer • 14 dilution levels • Dilution ratios: 66700 to 8 • Triangular forced-choice • Single sniffing port • 10 L sample size
Source: Heber et al., 2002 Odor sampling at fan outlet Equality Vane anemometer Severe dust buildup Vacuum chamber
Exhaust Probe manifold Bag filling Sample lines Analyzer 1.0 L/min M3 H2S M4 F4 P2 3.6 L/min Filter Analyzer manifold Solenoid valves
Static Pressure, Pa Fan with Plastic Shutter Cleaned New belt Published Dirty 90 80 70 60 50 40 30 20 Dirty is 14-24% < published 10 0 0 1 2 3 4 3 Airflow, m /s
In-Field Fan Tests Further airflow degradation found in in-field tests and fans operating more frequently had greater degradation factors
Data Acquisition System • State of the art hardware, software • On-line data inspection • Alarm emails • Automatic backups • Instrument interfacing • Sample line control
Hydrogen Sulfide Concentrations 40 35 30 25 20 Concentration, ppb 15 10 5 Exhaust air (mean=19.7±4.8 ppb) 0 -5 2/27 3/13 3/27 4/10 4/24 5/8 5/22 6/5 Day of test, mm/dd
Hydrogen Sulfide Concentrations 40 Exhaust air 35 30 25 20 Concentration, ppb 15 10 Inlet air (mean=3.1±4.3 ppb) 5 0 -5 2/27 3/13 3/27 4/10 4/24 5/8 5/22 6/5 Day of test, mm/dd
Hydrogen Sulfide Concentrations and Emission Rates 40 9 Exhaust air 35 8 -1 30 7 25 6 20 5 Emission rate (mean = 5.6 ± 1.3 μg/s-AU) Concentration, ppb Emission, mg s 15 4 10 3 5 2 0 1 Inlet air -5 0 2/27 3/13 3/27 4/10 4/24 5/8 5/22 6/5 Day of test, mm/dd
Odor Concentrations (OU/m3) 500 120 -3 100 m 400 E ODCb 80 300 ppb 60 ODCb (mean = 42 ppb) Odor conc., OU 200 40 100 20 0 0 2/27 3/13 3/27 4/10 4/24 5/8 5/22 6/5 Day of test, mm/dd
Odor Concentrations (OUE/m3) 500 -3 m 400 E 300 Odor conc., OU 200 Exhaust (mean = 316 OUE/m3, n=13) 100 0 2/27 3/13 3/27 4/10 4/24 5/8 5/22 6/5 Day of test, mm/dd
Odor Concentrations (OUE/m3) 500 -3 m 400 E Exhaust 300 Odor conc., OU 200 Inlet (mean = 51 OUE/m3, n=13) 100 0 2/27 3/13 3/27 4/10 4/24 5/8 5/22 6/5 Day of test, mm/dd
50 Mean = 50,400 OUE/s = 65.6 OUE/s-AU = 7.53 OUE/s-m2 Odor emission -1 rate AU 40 -1 s E 30 20 Emission, OU 10 mc=36.4% pH=8.4 mc=26.0% pH=8.3 mc=25.0% pH=8.3 0 2/27 3/13 3/27 4/10 4/24 5/8 5/22 6/5 Day of Test
700 50 Odor emission rate -1 -1 600 s AU 40 3 500 -1 s E 30 400 300 Ventilation Rate, m 20 Emission, OU 200 10 100 Ventilation rate 0 0 2/27 3/13 3/27 4/10 4/24 5/8 5/22 6/5 Day of Test
700 50 Emission rate -1 s -1 600 40 3 AU C 500 o -1 30 s E 400 20 Ventilation Rate, m Temperature, 300 Emission, OU Inlet T 10 200 0 100 Ventilation rate 0 -10 2/27 3/13 3/27 4/10 4/24 5/8 5/22 6/5 Day of Test
50 700 Emission Rate -1 -1 600 s 40 3 AU C 500 o -1 30 s E 400 Exhaust T 20 Temperature, Ventilation Rate, m 300 Emission, OU Inlet T 10 200 0 100 Ventilation Rate 0 -10 2/27 3/13 3/27 4/10 4/24 5/8 5/22 6/5 Day of Test
Hedonic Tone v. Odor Concentration Inlet air mean = -1.9 Exhaust air mean = -5.0
Conclusions • Mean exhaust air H2S concentration was 20 ppb. • Mean H2S emission rate was 5.6 μg/s-AU. • Mean hedonic tone of exhaust air was -5. • Mean exhaust odor intensity was 3200 ppm BIW. • Mean exhaust odor concentration was 316 OUE/m3. • Mean odor emission was 66 OUE/s-AU.
Thank you! www.AgAirQuality.com