
State Performance Summary and Overdue Reports Analysis
This report presents a comprehensive analysis of state performance metrics, focusing on overdue reports across various categories. It highlights the percentage of overdue reports by state, indicating areas for improvement and ensuring accountability. The statistical data compares performance across states, providing insights into trends and offering a basis for actionable recommendations. The analysis is vital for stakeholders seeking to enhance operational efficiency and compliance within state reporting frameworks.

State Performance Summary and Overdue Reports Analysis
E N D
Presentation Transcript
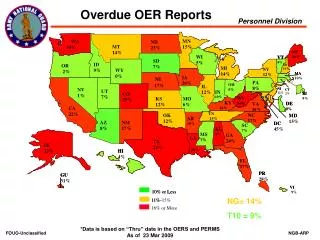
MN MN WA WA ND ND MT MT 15% 53% 30% 47% 30% 23% 14% 46% ME ME WI WI VT VT 40% 16% SD SD 10% 5% 4% 29% ID ID OR OR NH NH 39% 7% MI MI NY NY 11% 36% 40% 9% WY WY 34% 2% 23% 14% MA MA 28% 12% 53% 0% IA IA 10% NE NE PA PA 20% 34% 35% OH OH 17% IL IL 8% 25% NV NV NJ NJ 5% 25% CT CT UT UT IN IN 24% 12% 12% RI RI CO CO 2% 53% 1% 7% 32% 17% 10% WV WV 8% KS KS MO MO 51% 29% KY KY DE DE VA VA 32% 24% 38% 12% 6% 16% CA CA 49% 16% 8% 16% 28% . . TN TN 22% 55% NC NC OK OK MD MD AR AR 45% 15% 38% 17% 21% 12% 15% AZ AZ NM NM DC DC 19% 42% SC SC AL AL 17% 8% 17% 20% 45% 11% 7% MS MS 28% 40% GA GA LA LA 11% 1% 56% 24% TX TX AK AK 49% 21% 52% 28% HI HI 33% 22% 4% FL FL 17% 42% PR PR GU GU 28% 31% VI VI 10% or Less 10% or Less 9% 11% 11% - - 15% 16% or More Overdue OER Reports NG= 14% T10 = 9% *Data is based on “Thru” date in the OERS and PERMS As of 23 Mar 2009