Lesson 13-4
130 likes | 274 Vues
Lesson 13-4. Measures of Variation. Transparency 4. Click the mouse button or press the Space Bar to display the answers. Transparency 4a. Objectives. Find the range of a set of data Find the quartiles and the Interquartile range of a set of data. Vocabulary. range –

Lesson 13-4
E N D
Presentation Transcript
Lesson 13-4 Measures of Variation
Transparency 4 Click the mouse button or press the Space Bar to display the answers.
Objectives • Find the range of a set of data • Find the quartiles and the Interquartile range of a set of data
Vocabulary • range – • measures of variation – • quartiles – • lower quartile – • upper quartile – • Interquartile range – • outlier –
Measure of Dispersion • How spread out is the data? • Range is one measure (biggest – smallest value) • A quartile (Q) is one-quarter of the ordered data set (25%) • The median is the second quartile (Q2) • The interquartile range or IQR (Q3 – Q1) is a measure of the spread of the middle of the data set • The IQR is used in statistics to identify outliers in the data Q1 Q2 Q3 25% 25% 25% 25% smallest biggest Interquartile Range Range
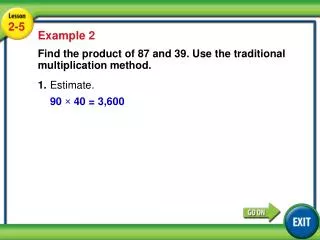
Answer: The range of the yardage is or 1799 yards. Example 1 College FootballThe teams with the top 15 offensive yardage gains for the 2000 season are listed in the table. Find the range of the data. The greatest amount of yardage gains is 6588, and the least amount of yardage gains is 4789.
Example 2 GeographyThe areas of the 5 largest states are listed in the table. Find the median, the lower quartile, the upper quartile, and the interquartile range of the areas. Explore You are given a table with the areas of the 5 largest states. You are asked to find the median, the lower quartile, the upper quartile, and the interquartile range.
median Solve Example 2 cont Plan First, list the areas from least to greatest. Then find the median of the data. The median will divide the data into two sets of data. To find the upper and lower quartiles, find the median of each of these sets of data. Finally, subtract the lower quartile from the upper quartile to find the interquartile range. 124 147 164 269 656
Example 2 cont Answer: The median is 164 thousand square miles. The lower quartile is 135.5 thousand square miles and the upper quartile is 462.5 thousand square miles. The interquartile range is 462.5–135.5 or 327 thousand square miles. Examine Check to make sure that the numbers are listed in order. Since 135.5, 164, and 462.5 divide the data into four equal parts, the lower quartile, median, and upper quartile are correct.
[ ][ ] Example 3 Identify any outliers in the following set of data. Step 1Find the quartiles. The brackets group the values in the lower half and the values in the upper half. The boxes are used to find the lower quartile and upper quartile.
The interquartile range is Example 3 cont Step 2Find the interquartile range. Step 3Find the outliers, if any. An outlier must be 1.5(15) less than the lower quartile, 72, or 1.5(15) greater than the upper quartile, 87. Answer: There are no values greater than 109.5. Since 47 < 49.5, 47 is the only outlier.
Summary & Homework • Summary: • The range of a data set is the difference between the greatest and the least values of the set and describes the spread of the data • The interquartile range is the difference between the upper and lower quartiles of a set of data. It is the range of the middle half of the data • Outliers are values that are much less than or much greater than the rest of the data • Homework: • pg 734; 12-23