JBoss Network Enterprise Manager
100 likes | 230 Vues
The JBN Enterprise Manager Console offers a range of key features designed for efficient resource management. Key functions include resource discovery through auto-scan and file scan mechanisms, grouping resources with compatible and mixed groups, and implementing fine-grained access control. It allows for the configuration of alerts based on baseline metrics to ensure proactive monitoring. Additionally, it supports various chart types for detailed insights, enabling trend analysis and effective management of platform, server, and service resources.

JBoss Network Enterprise Manager
E N D
Presentation Transcript
JBoss Network Enterprise Manager A detailed description of some of the key features of the JBN Enterprise Manager console The Professional Open Source™ Company
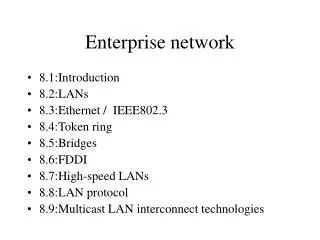
Agenda • Resource discovery. • Ways to group resources. • Creating fine-grained access control. • Types of charts. • Baseline metrics. • Configuring alerts. 2 The Professional Open Source™ Company
Resource Discovery • Two mechanisms for adding managed resources to the inventory: • Auto Scan • Quick. • Looks in the registry (windows only) and process table. • File Scan • Slow • Searches the file system. 3 The Professional Open Source™ Company
Grouping Resources • Compatible Groups • All members must be of the same resource type, e.g. all JBoss 3.2 servers. • Applications • Can contain any one of the following: • set of Service resources, or • set of Groups of Service resources. 4 The Professional Open Source™ Company
Grouping Resources • Mixed Groups • Can contain any one of the following: • set of Groups, or • set of Platforms, Servers and Services, or • set of Applications. • Auto-Groups • Created by JBN-EM, used to provide naturally-occurring/obvious groups. 5 The Professional Open Source™ Company
Access control • Permissions are ‘stacked’ as resources are: • Platform>Server>Service. • A good use for Mixed groups is for doing access control. • Define the group. • Define the role. • Associate them. • Result: User’s in that role will only be able to manage what is in that group. 6 The Professional Open Source™ Company
More on Metrics: Charts • Chart-types: • Multiple Metrics, Single Resource • Normal set of chart displayed on Monitor page. • Single Metric, Single Resource • Detailed view. • Single Metric, Multiple Resources • Seen when viewing charts for groups, e.g. auto-groups and compatible groups. 7 The Professional Open Source™ Company
More on Metrics: Baselines • Baseline for a metric: • Low/High/Average values over a rolling time window. • Useful for trend analysis, and generating appropriate alerts. • Once a metric enters its high or low range, i.e. it’s OOB (Out Of Bounds), it is marked as a Problem Resource. • Baselines can be • Automatically calculated on a scheduled basis. • Automatic calculation can be triggered manually. • Baseline values can be specified manually. 8 The Professional Open Source™ Company
More on Alerts • Can specify action invocation timing: • Immediately upon detecting trigger condition. • When frequency limit is exceeded in a given period. • Can specify compound trigger events for an Alert: • Event1 OR Event2 OR Event3. • Event4 AND Event5. • Alerts can be filtered conditionally: • Disable alert until re-enabled manually or by recovery alert. • Prevent alert ‘storms’ by disabling alert after its fired the first time. • Disregard control actions that are defined for related alerts. • Multiple alerts will not trigger the same control action. • Filter notification actions that are defined for related alerts. • Multiple alerts will be aggregated and only a single alert notification (e.g. email) will be issued. 11 The Professional Open Source™ Company
Q & A • Future WebEx presentations coming soon! • Will demonstrate in more detail the features provided by JBN EM, e.g. the Command Line Shell, JBoss monitoring, Tomcat monitoring. Thanks for your time! 13 The Professional Open Source™ Company