Download
1 / 66
660 likes | 681 Vues
Learn about the South Carolina Department of Natural Resources' Flood Mitigation Section and their efforts to update FEMA's Flood Insurance Rate Maps through the Map Modernization Initiative. Discover the benefits of accurate flood hazard mapping and the importance of flood insurance and floodplain management.

E N D
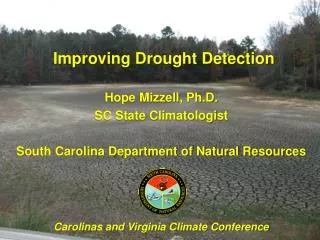
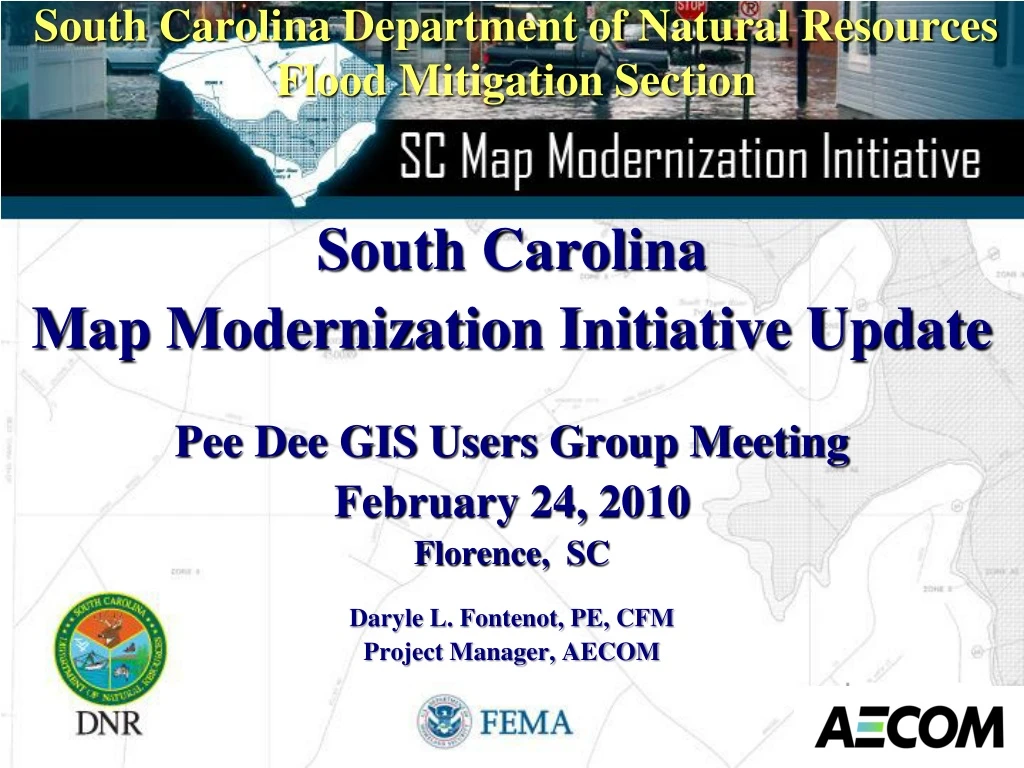
South Carolina Department of Natural Resources Flood Mitigation Section South Carolina Map Modernization Initiative Update Pee Dee GIS Users Group Meeting February 24, 2010 Florence, SC Daryle L. Fontenot, PE, CFM Project Manager, AECOM
National Flood Insurance Program (NFIP) • Flood Insurance • Property owners in participating communities purchase flood insurance • Floodplain Management • Participating communities adopt and enforce flood damage prevention ordinance • Flood Hazard Mapping • Develop flooding limits
Map Modernization • Nationwide, 5-year, $1 billion program • Update FEMA’s Flood Insurance Rate Maps (FIRMs) for the nation’s • Produce quality maps • Reduce map production time • Reduce cost/time for future updates • Produce seamless, nationwide flood data
Risk MAP (Mapping, Assessment and Planning) Through collaboration with State, Local, and Tribal entities, Risk MAP will deliver quality datathat increases public awarenessand leads to action that reduces riskto life and property
Why SC Is Undertaking This Project • Property owners will be more accurately informed of flood risks, and will be able to make informed decisions when purchasing flood insurance • Accurate, up-to-date flood hazard information crucial to protect lives and property
SC Flood Mapping Program Program established to implement the Cooperating Technical State Partnership with the Federal Emergency Management Agency (FEMA) Ownership and responsibility for Flood Insurance Rate Maps (FIRMs) delegated to State Education local entities on the Map Modernization process, nature and purpose of their study, intent of use of data collected, and post-preliminary process QA/QC of all mapping products
SCDNR Map Mod Team • Outreach Coordinator – Vacant • State NFIP Coordinator – Lisa Jones • Compliance Specialist – Maria Cox • Engineering & Mapping Lead – Feleke Arega & Masaaki Kiuchi • State Hydrologist – Bud Badr • LiDAR Lead- Jim Scurry • Lead Engineering Firm AECOM and URS
Flood Study Completion Schedule
Study Process Scoping/Information Search Base Map Acquisition Terrain Data Acquisition Field Survey Hydrology Hydraulics Mapping Reporting
Study Process Overview Base Map Selection DFIRM Production Post Preliminary Processing (12-18 months) Project Scoping Conducted PDCC Meeting Hydrology & Hydraulic Studies (Includes Coastal modeling|) FIS Report Preparation (Typically 9 – 12 months) Preliminary Map/Report Production Phase (Typically 18 – 24 months)
Digital FIRM Topography + Flood Data + Base = Digital FIRM
Information Search Research on historical floods ineach county Coordination with other agencies for High Water Mark Information and recent projects
Factors for Study Priorities Areas of existing or anticipated development Area where new road crossings have been built Areas affected by flood-control structures and/or channelization Areas where natural physical changes in the floodplain have been significant Areas that were studied by approximate methods and unmapped areas, especially those with development pressure
Factors for Study Priorities (cont.) Areas where the community has experienced flooding outside mapped floodplains, with severe damage to buildings and/or infrastructure Areas where mapped flood hazards do not match those shown on contiguous FIRMs Areas where flood data (BFEs, floodplains, and regulatory floodways) are likely to be changed the most by a restudy
Coordinated Needs Management Strategy (CNMS) CNMS • Initiative to update the way FEMA organizes, stores and analyzes flood hazard mapping needs information for communities • Provides an approach and structure for the identification and management of flood hazard mapping needs that will provide support to data driven planning and flood map update investment process in a geospatial environment. • Goal is to produce a national inventory database of flooding sources corresponding to our mapped inventory and to begin referencing mapped flooding sources as validated or as having an unmet need • Three phases to program to be completed and integrated into the Risk MAP program by FY2011: • Phase I – National summary map • Phase II – Stream level inventory • Phase III - Stream level validation
CNMS A spatial Geodatabase that tracks the community’s needs and requests for FEMA-funded flood studies.
CNMS Validation • The model validation process utilizes remotely sensed & aerial photos to analyze changes with land use & stream channels.
CNMS Database • Validation criteria for detailed streams are populated & associated with need polygons in CNMS GDB. Streams with invalid models are tracked as “Unmet Needs” along with studies requested by the community that are not funded.
Base Map Information Base Map Sources • County or State Provided Imagery • USGS DOQQ
Base Map Information Capture /Digitize Waterline and other Data
Terrain Data Building block for hydrology & hydraulic study Source - Existing topographic data from each county New LiDAR data
WISE Terrain Analyst: DTM to TIN to DEM Terrain Data
TINs for Hydraulics: Cross Sections\Transects, Redelineation, Flood Mapping Terrain Data
DEMs for Hydrology: Flow Vectors, Drainage Area Calculation, Basin Delineation Terrain Data
Study Methods Methods for Updated Mapping • Riverine Detailed Study • Riverine Limited Detailed Study • Approximate Study • Coastal Study • Redelineation (FEMA Studies and Others)
Detailed Study • Traditional Detail Study • Sections Field Surveyed • Elevation Reference Marks • Cross Sections • Historic Interviews • All bridge and culvert crossings • All Hydraulic Structures Surveyed • Detailed Hydrologic Analysis • Extensive Model Calibration • Traditional Mapping • Floodways • Floodway Data Table • Flood Profile
Riverine Modeling Approach Limited Detailed Field Survey Detailed Calibration Floodway Mapping • Supported by H&H modeling • Hydrology from Regression Equations • HEC-RAS models developed • Calibrated to available data • Floodplain mapped to Terrain data Detailed Study
Riverine Modeling • Results from HEC-RAS brought back into WISE • Mapping performed by intersecting WSEL TIN with ground TIN
Limited Detail Study • Replaces Unnumbered A Zones • Extend to 1sq. mile or limit of Current Zone A • Topo Data Sources • USGS 30 meter DEMs • USGS 7.5 min hypsography • Local / Countywide Topo Data • LIDAR • Hydrology Based on Regression Equations (or USGS gages)
Limited Detail Study • Hydraulic Models Developed • Hydraulic Structures Measured (No Survey) • Selected Channels Measured • Rough Floodway • Model Review by Engineer • N-Values • Ineffective Areas Considered • Some Calibration
Limited Detail Study • Mapping Details • Flood boundaries mapped from model output • BFEs can potentially be shown (as in NC) • Cross Sections Shown on Maps • Flood Hazard Data Tables in FIS Report • Floodways Not Shown • DFIRM database tables/attributes • Can be Considered a Zone AE
Approximate Studies • Replaces Unnumbered A Zones • Much more automated approach • Hydrology from Regional Equations • Hydraulic Models Developed • Channel dimensions from rating curve • A more automated cross section placement • Standard N-values are used • No Hydraulic structures are included • No floodway • No calibration to High Water Marks • Limited Model Review / Modifications by Engineer – model defaults accepted
Approximate Study • Mapping Details • Flood boundaries mapped from model output • BFEs are not shown(can be provided as a GIS layer) • Cross Sections NOT shown • Floodways Not Shown • Is considered a Unnumbered A Zone
Coastal Modeling • Topography • Bathymetry • Stillwater Elevation • Wave Setup • Wave Runup and Erosion Analysis • Wave Height Analysis • Mapping of Flood Elevations and Zones
Coastal Modeling Approach • Hydrodynamic Storm • Surge Modeling • Stillwater Elevation • Wave Setup Coastal Flood Hazard Analysis • Wave Runup & Erosion Analysis • Wave Height Analysis • Mapping of Flood Elevations and • Zones to Terrain Data Coastal Detailed Study
Coastal Modeling Storm Surge ADCIRC Storm Surge Model Grid 39
Coastal Modeling Storm Surge (1) Model Validation Hurricane Hazel Hurricane Hugo Hurricane Ophelia (2) Production Runs ADCIRC 2D Wave model (3) Storm Statistics • Produce 10-, 50-, 100-, and 500-yr stillwater plus wave setup values for overland wave modeling 40
Coastal Modeling Wave Height Analysis in WISE • Erosion • Calculations automated – much quicker than CHAMP • CHAMP, WHAFIS, & RUNUP • Exports topo and land use data into CHAMP for WHAFIS & RUNUP • Mapping • Imports results from CHAMP into WISE for mapping
Redelineation • Used to Update Effective Mapping with new Terrain Data • Datum Conversion to NAVD 88 from NGVD 29 • Foundation is the FEMA Profile • Recreated • QC Checked against FDT • Datum Shift • Floodways and Cross Sections are Digitized
Redelineation • Stream Stations usually are not adjusted to new topo • FEMA Lettered Sections are supplemented with “mapping sections” • Efforts made to ensure tie-ins to downstream and upstream studies • Notes added to profiles as needed referencing adjacent Limited Detail Studies
Floodplain Mapping Fully Automated: • Mapping of flood boundaries • Automated creation of profiles • Placement of BFE’s to FEMA standards • Generation of Floodway Data Tables DFIRM product