Download
1 / 100
1k likes | 1.02k Vues
Strategy Practitioner Tools. Core Tools. 0. Table of Contents. 16 KEY PERFORMANCE INDICATORS 17 MARKET PROFITABILITY 18 PORTFOLIO ANALYSIS 19 REAL OPTIONS/STRATEGIC OPTION 20 SCALE CURVE 21 SCENARIO ENVISIONING

E N D
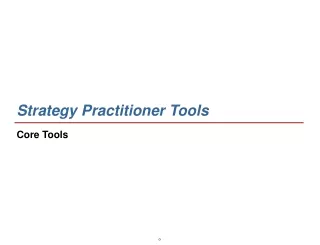
Strategy Practitioner Tools Core Tools 0
Table of Contents 16 KEY PERFORMANCE INDICATORS 17 MARKET PROFITABILITY 18 PORTFOLIO ANALYSIS 19 REAL OPTIONS/STRATEGIC OPTION 20 SCALE CURVE 21 SCENARIO ENVISIONING 22 SENSITIVITY ANALYSIS 23 SEVEN S FRAMEWORK 24 STAKEHOLDER ANALYSIS 25 SWOT 26 VALUE BASED MANAGEMENT 27 VALUE CHAIN ANALYSIS 28 VALUE TREE 29 VOICE OF THE CUSTOMER 1 ANALYSIS PLAN 2 BREAKTHROUGH MODEL 3 COMPETITIVE BENCHMARKING 4 COMPETITIVE POSITIONING 5 CORE COMPETENCTY ANALYSIS 6 CUSTOMER SEGMENTATION 7 EXPERIENCE CURVE 8 FINANCIAL MODELING 9 FIT VS. ATTRACTIVENESS MODEL 10 FIVE FORCES ANALYSIS 11 GANTT CHART 12 GAP ANALYSIS 13 GROWTH SHARE MATRIX 14 INDUSTRY VALUE CHAIN ANALYSIS 15 ISSUE TREE/ISSUE MAP
CLIENT EXAMPLE: HYPOTHESIS/ANALYTICAL PLAN Hypothesis Analysis Info. Required Info. Source End Products Overall Hypothesis Organizational philosophy needs to be modified Supporting Hypothesis Existing organization does not adequately support the business strategy Business System Diagrams • Define business system, operating environment • Define CSFs, organizational requirements along business system • Define how existing organization supports business system, CSFs • Key activities, processes by LOB • CSFs along business system by LOB • Existing organizational elements impacting business system • Management interviews • Secondary research • HR documents Activity ~~~~~~~~ ~~~~~~~~ ~~~~~~~~ CSF ~~~~~~~~ ~~~~~~~~ ~~~~~~~~ Financial Metrics Even after adjusting for asset write-up, financial performance has not met corporate expectations or competitive standards due to an inappropriate organization (and cost) structure • Financial performance vs. competitors, budget/plans • Overview of cost structure (e.g., fixed vs. variable costs) • ROA, NI adjusted for asset write-ups • Historic and projected financial data • Asset write-up information • Summary cost, volume info for production units • Annual reports, 10Ks, 10Qs, etc. • Company financial reports • Financial department interviews Data/Info Flows Org Charts The increasing complexity of business and the evolving importance of, and coordination required between specialized expertise requires changes in the decision-making process and information flows • Define actual vs. perceived vs. “real” organization chart, decision-making process/responsibilities; identify gaps • Define expertise, info required to make decision, organizational requirements • Define evolving nature of organization and information flows • Key decisions • Key individuals involved in decision-making process • Information flows • Management interviews • Organization charts • Memos/documents on management processes • System flow charts Analysis Plan Analysis Plan Summary The analysis plan details a problem-solving process and specific analysis which must be developed to assess a hypothesis. The analysis plan must be flexible and that the analyses to be conducted and the deliverables to be produced may change during the course of the project.
Analysis Plan When To Apply When it is necessary to lay out problem-solving process in depth/detail and identify the analyses which need to be undertaken to validate the selected hypotheses Approach • Define an issue on which a specific action depends and phrase it as a “yes” or no” question • Establish a hypothesis: a statement of likely resolution of the issue including the reasons for answering “yes” or “no” • Develop an analysis statement that outlines the “models” that will be explored in order to prove or disprove the hypothesis • Identify the likely location or means of obtaining data to accomplish the analysis • Develop end products (presentations) to graphically represent the output of the analysis
Analysis Plan Citations - Client and Industry Experience Source List • Robert M. Grant, “Contemporary Strategy Analysis”, 3rd Edition • Compaq/Technology/Vasu Krishnamurthy • Galileo/Travel/ Spencer Lin & Vasu Krishnamurthy • Post Office Counters Ltd./Transportation Services/KIT • database • PwC MCS/Consulting/Vasu Krishnamurthy • United Airlines/Travel/Vasu Krishnamurthy
Breakthrough Model Breakthrough Model Summary The Breakthrough model focuses attention on most substantial opportunities for creating value for customers and shareholders. Industry Company Market/Product Trends in the External Repositioning Market/product economic strategy and basis 3 environment in for competition which the markets exist Industry Enterprise Transformation Alignment 1 4 Internal Best practices Capabilities of the company’s across this and people, processes, 2 similar industries technology, systems and Best Practice structure Performance
Breakthrough Model When To Apply Utilize the Breakthrough model to identify and categorize all opportunities to create substantial incremental shareholder value. Approach • When creating a Breakthrough model, the following criteria should be considered: • Summarize all opportunities to improve business performance from other analyses • Categorize them into four groups: • Enterprise alignment • Best practice performance • Market/product repositioning • Industry transformation • Determine approximate economic value of each type of strategy
Breakthrough Model Citations - Client and Industry Experience Source List • Non-PwC: • Toyota: the lean production system • • Frito-Lay: end-to-end supply chain • management and the use of • advanced technology • • Intel: high velocity product • development • • Amazon.com: Internet based • channels of distribution • on behalf of shareholders. • Paul Elkin, “Mastering Business Planning and Strategy: The Power and Application of Strategic Thinking”
NEW PRODUCT DEVELOPMENT CYCLE TIME 20 = Maximum # = Average or Most Common = Minimum 18 16 14 13.5 12 Months 10.5 10 9.0 8 7.0 Average = 6.7 6.0 6.5 6 6.0 6.0 5.0 5.0 4.5 4.5 4 3.5 2 0 A B C D E F G I J K L M N Home Goods Perishables Apparel • Best Practices • ~~~~~~~~~~~~~~~~~~~~~~~~~~~~~~~~~~~~ • ~~~~~~~~~~~~~~~~~~~~~~~~~~~~~~~~~~~~ • ~~~~~~~~~~~~~~~~~~~~~~~~~~~~~~~~~~~~ Competitive Benchmarking Competitive Benchmarking Summary Competitive Benchmarking is used to identify and measure the factors that determine why a process has specific cost, quality or timing attributes and incorporate the best practices into an actionable change plan. It does so in part, by comparing a company’s performance in key areas with respect to its competitors’ performance. Examples of presenting Competitive Benchmarking findings:
Competitive Benchmarking When To Apply While not a comprehensive comparison, Competitive Benchmarking illustrates the efficiency of specific processes in comparison to a company’s competitors. Select companies to benchmark against carefully - remember that companies outside the client’s industry may be the best candidates. Ensure that data collected are comparable and the the right processes are benchmarked; those which have the biggest impact on customer service/satisfaction/value. Approach • Examine the issues most important to the company’s situation to determine whether roles, processes, or strategic issues • should by benchmarked • Identify key performance variables and determine which companies to use for comparison (both within company’s • industry and outside the industry) • For process benchmarking, determine the metrics to be measured; these can be key performance indicators (KPI’s), or • other measurements • Establish data collection methodology (industry sources, on-line databases, on-site visits, phone interviews, survey • questionnaires, competitors, etc.) • Measure client company performance • Measure performance of competitors and best practice leaders • Illustrate the spectrum of performances on an appropriate graph • Determine gaps and reasoning • Develop action plans/recommendation to address gaps • Implement actions and monitor progress
Competitive Benchmarking Citations - Client and Industry Experience Source List • Paul Elkin, “Mastering Business Planning and Strategy: The • Power and Application of Strategic Thinking” • Liam Fahey, Robert M. Randall, “The Portable MBA in • Strategy” • Robert M. Grant, “Contemporary Strategy Analysis”, 3rd • Edition • Michael Gould, Andrew Campbell, Marcus Alexander, • “Corporate-Level Strategy: Creating Value in the • Multibusiness Company” • Ball Corporation/Packaging /Vasu Krishnamurthy & • Mike Weiss • Motorola/Technology/Vasu Krishnamurthy • PwC MCS/Consulting/Vasu Krishnamurthy • United Airlines/Travel/Vasu Krishnamurthy
Market Strength Low Medium High Competitive Positioning Competitive Positioning Summary Competitive Positioning analysis shows how a company is positioned in its industry relative to its competitors Positioning Map Example: Entertainment High Channel Strength Low Low High • Content Strength • Intellectual property strength • Product strength
STEP DATA REQUIRED SOURCE(S) 1. Choose axes that are relevant to customer decision-making (first) and those which differentiate suppliers (second) 2. Illustrate where competitors lie on map(s) 3. Interpret map for strategic implications (e.g., clusters or open spaces) • Information on industry as a whole • Information on competing companies’ strategies and positioning • Trade associations • Trade periodicals and publications • Information services • Analyst reports • Various companies’ annual reports and other public information • Interviews with competitor management • Industry experts Competitive Positioning When To Apply To show clients that you understand their market and position. Can also be used to develop strategic recommendations. Approach
Competitive Positioning Citations - Client and Industry Experience Source List • Paul Elkin, “Mastering Business Planning and Strategy: The Power and Application of Strategic Thinking” • Robert M. Grant, “Contemporary Strategy Analysis” • Henry Mintzberg, James Brian Quinn, Sumantra Ghoshal, “The Strategy Process” • Henry Mintzberg, James Brian Quinn, “The Strategy Process: • Concepts, Contexts, Cases” • Barclays Global Investors (BGI)/Banking/KIT database • Blue Cross/Insurance/Mike Weiss • Boots/Retail/KIT database • Galileo/Travel/ Spencer Lin & Vasu Krishnamurthy • Giddings & Lewis/Machine Tool/Vasu Krishnamurthy • Osh Kosh B’ Gosh?SP/Retail/Mike Weiss • PwC MCS/Consulting/Vasu Krishnamurthy • Save & Prosper/Banking/KIT database
COMPETENCIES MODEL - FRAMEWORK Strategic/ Financial Planning Technology Development Product Development Mfg/Joint Venture Sales/ Distribution Customer Refill Support Other Customer Service Marketing Example: McDonald’s Core Competence (CC) - A competence which delivers a sustainable competitive advantage in current markets, provides access to a wide variety of markets, and makes a significant contribution to the perceived customer benefits of the end product. • Fast, affordable, fun, family dining experience Critical Strategic Capabilities (SC) - The capabilities in which a company is a leader. These capabilities are the source of competitive advantage. • Marketing and brand mgmt. • Training • Franchise mgmt. • Product innovation Critical Enabling Capabilities (EC) - The capabilities in which a company is competitively equivalent to other market leaders. These capabilities are often the source of a barrier to entry. • BigMac recipe • High quality, low price product sourcing • Efficient operation Primary Capabilities (PC) - Minimum functional and technical requirements necessary to participate. • Hamburger preparation • Menu selection Core Competency Analysis Core Competency Analysis Summary Core Competency Analysis provides a practical and systematic process to identify a company’s core competencies and assess key competitive advantages. Examples of Core Competency Models:
Core Competency Analysis When To Apply Employ Core Competency analysis to evaluate a company’s capabilities in each function of the value chain with a hierarchical model which identifies capabilities and the degree to which they provide competitive advantage and can be leveraged. Please note that there is a risk of defining too narrowly the market in which the client competes, thus focusing on the wrong competency requirements or a subset of the competencies required to effectively compete. It is key that those projects and programs that aim at developing core competencies should not be open to re-prioritization at a later stage. Approach • Adhere to the following guidelines when analyzing core competencies and developing a Competencies Model - Framework: • Interview company senior management and business line management as well as competitor management • Define company’s business system and activities performed within each function - Based on the total range of • capabilities identified, ask the questions: • Which ones do we have to be “good at”? • Which ones do we have to be “market/world leading at”? • Determine whether each activity is a primary capability, a critical enabling capability, a critical strategic capability, or a • core competence, based on the degree to which the activity provides competitive advantage and can be leveraged • Note that while all the identified capabilities will be critical to achieve the vision and strategy, the questions will help • distinguish core from non-core by invoking management attention and reflection in a systematic and structured manner
Core Competency Analysis Source List Citations - Client and Industry Experience • David A. Aaker, “Developing Business Strategies”, 5th Edition • Robert M. Grant, “Contemporary Strategy Analysis”, 3rd • Edition • Michael Gould, Andrew Campbell, Marcus Alexander, • “Corporate-Level Strategy: Creating Value in the • Multibusiness Company” • Henry Mintzberg, Bruce Ahlstrand, Joseph Lampel, “Strategy • Safari: A Guided Tour Through the Wilds of Strategic • Management” • Henry Mintzberg, James Brian Quinn, Sumantra Ghoshal, • “The Strategy Process” • Henry Mintzberg, James Brian Quinn, “The Strategy Process: • Concepts, Contexts, Cases • Galileo/Travel/ Spencer Lin & Vasu Krishnamurthy • Giddings & Lewis/Machine Tool/Vasu Krishnamurthy • MetLife/Insurance/KIT database • PwC MCS/Consulting/Vasu Krishnamurthy • Save & Prosper/Banking/KIT database
Establish Segmentation Objectives Data Assessment Model Construction Build Closed Loop Performance Tool Customer Segmentation Methodology Customer Segmentation Methodology Summary High level work flow for a customer segmentation What data is needed to meet the objectives? How much of that data can be obtained internally? externally? What data is essential to the segmentation? What data can be a focus for further improvement in the future? Define the variables of the model with accessible data? Develop an analytical tool that utilizes the variables to determine a customer ranking or grouping (ie most ideal partner to most inefficient partner). Refocus internal efforts based on segmentation outcome. Establish a way to capture the key data needed to segment customer base. Utilize the data on an ongoing basis to improve performance and continually reward the better performing customers. What are the objectives of the segmentation? Better ROI, redistribute spending, change sales efforts?
Hold inventory • Credit problem • Basic fabrics • Specialty products • Narrow customer base Niche Strategy (specialized product to narrow customer base) “Opportunistic” Strategy • Sell to manufacturers before fabric purchase • Established credit • Broad customer base • Basic fabrics • Sell to manufacturers before fabric purchase • Established credit • Focused customer base • Novel fabrics (“fashion forward”) Differentiation Strategy (specialized product to broad customer base) Low-Cost Strategy Customer Segmentation Customer Segmentation Summary Customer segmentation is a division of a market into distinct groups of buyers who might require separate products and/or marketing mixes. THE CONVERTER MARKET CAN BE SEGMENTED USING TWO VARIABLES: ECONOMIC RISK AND FABRIC INNOVATION High • Economic Risk • Inventory position • Credit status • Product mix • Customer base Low Low High • Fabric Innovation • Percent novelties • Order size • Number of collections
STEP DATA REQUIRED SOURCE(S) • 1. Identify segmentation variables and segment the market • a) Survey Stage: Conduct interviews/focus groups with consumers to gain insight into motivations, attitudes, and behavior • b) Analysis Stage: Apply factor analysis to data to remove highly correlated variables; apply cluster analysis to create a number of maximally different segments • 2. Form segments by looking at consumer characteristics as well as consumer responses • a) Geographic Segmentation • b) Demographic Segmentation • c) Psychographic Segmentation • d) Behavioral Segmentation • Results from focus groups, interviews, and surveys • Customer characteristics: demographics, statistics, etc. • Focus groups, interviews, surveys • Company data Customer Segmentation When To Apply Applicable when it is useful to better identify marketing opportunities, to develop the right offering for each target market, or to be able to reach the target market in the most efficient manner possible. Approach
Customer Segmentation Source List Citations - Client and Industry Experience • Paul Elkin, “Mastering Business Planning and Strategy: The Power and Application of Strategic Thinking” • Robert M. Grant, “Contemporary Strategy Analysis” • Henry Mintzberg, James Brian Quinn, Sumantra Ghoshal, “The Strategy Process” • Galileo/Travel/ Spencer Lin & Vasu Krishnamurthy • General Mills/CIP/Johan Sauer • Giddings & Lewis/Machine Tool/Vasu Krishnamurthy • The Littlewoods Organization/Retail/KIT database • PwC MCS/Consulting/Vasu Krishnamurthy
Unit Cost ($) 1974 Slope 20% 50 1975 40 1976 1978 1977 30 1980 1979 1981 1982 20 1983 1984 10 200 400 600 800 1000 2000 4000 Unit Volume (Thousands) The Experience Curve Experience Curve Summary The Experience Curve forecasts future trends in cost/labor and determines the relative cost position of various competitors. The tool quantifies cost savings, theoretically achieved through experience gained in conducting a process. EXPERIENCE CURVE FOR WIDGETS - PROJECTIONS
Experience Curve When to Apply The Growth Share Matrix may be overly simplistic, market share does not always correlate with profitability and not all businesses have the same asset intensity. Conclusions are sensitive to business and market definitions; where lines are drawn. Practitioners must be creative, careful and consistent with market data. Approach Creating the Experience Curve requires yearly accumulated production volume for the entire indicative and individual competitors, and the unit cost for the entire industry and competitors (use price data if cost data is not available.) Data can be secured from government agencies, trade associations, and from internal company data. Step 1 Plot accumulated volume for different years against unit cost on a log/log scale (unit cost should be deflated by using a general index such as the GNP deflator, or specific indices for the various pars of cost such as materials and labor.) Step 2 Add a standard regression line to the graph. • CAVEATS: • Cost figures must be defined in the same manner by all sources of data. If company cost-accounting data is used, it may need to be adjusted for overhead allocations and other costs not considered to be part of the activity, process, or product under study. If price data is used pricing behavior of participants needs to be considered • Innovation within any functional area (e.g., product, process, distribution) can render the current experience curve useless as a strategy tool. Therefore, it is important to understand the environmental and customer trends in order not to rely too heavily on this analysis • The experience curve is only an analytical concept, and there is no guarantee that costs will actually decrease according to it. The company must actively manage costs down
Experience Curve Source List Citations - Client and Industry Experience • David A. Aaker, “Developing Business Strategies”, 5th Edition • The Boston Consulting Group, “Perspectives on Strategy” • Robert M. Grant, “Contemporary Strategy Analysis”, 3rd • Edition • Henry Mintzberg, Bruce Ahlstrand, Joseph Lampel, “Strategy • Safari: A Guided Tour Through the Wilds of Strategic • Management
Financial Modeling Financial Modeling Summary The financial model will allow us to test management assumptions and understand how different actions may affect performance on some key competitive dimensions.
Financial Modeling When To Apply Financial Modeling is effective in analyzing how a company’s performance, in core areas of business, will be affected by pursuing different courses of action. This tool facilitates an understanding of various cause-effect and provides a model by which to test various "what if" statements. Approach • Follow these steps to successfully create a Financial Model • Step 1 Gather information on key drivers ie. • From the cash flow analysis performed as part of the SVA • Data and insight from Voice of the Customer is another source of insight • Step 2 Map the relationships and identify factors which reinforce one another vs. those that have a negative relationship • (e.g. increase in price may have a negative effect on demand) • Step 3 Build the financial model based on the cause-effect relationships identified • Step 4 Gather data from industry analysis or internal corporate data • Step 5 Test the quality of the model by doing manual calculations on some "what if” • Step 6 Perform "what if" to assess the completeness of the model
Financial Modeling Source List Citations - Client and Industry Experience • Robert M. Grant, “Contemporary Strategy Analysis”, 3rd Edition • Flemings Fund Management Ltd (FFML)/Banking/KIT • database • Galileo/Travel/ Spencer Lin & Vasu Krishnamurthy • Osh Kosh B’ Gosh?SP/Retail/Mike Weiss • PwC MCS/Consulting/Vasu Krishnamurthy • United Airlines/Travel/Vasu Krishnamurthy
CATEGORY EVALUATION - SPECIALTY/SPIN-OFF EXAMPLE • Baked Goods • Bulbs • Cheese • Fruit • Kitchenware • Meat/Seafood • Nursery Stock • Snacks/Candy • Stationery • Decorative Accessories • Indoor Plants High • Nuts • Seeds • Trees/Shrubs • Gourmet Food • Bed/Bath • Pool/Patio/Gardening Category Fit With Company Medium • Crafts • Personal Care/Grooming • Specialty Apparel • Camping Equipment • Children’s Apparel • Drug/Vitamins/Health Food • Hardware/Tools • Hosiery/Lingerie • Women’s Apparel • Men’s Apparel • Women’s Large Size Apparel • Athletic Equipment • Fishing Equipment • Hunting Equipment • Sporting Good Apparel Low Low Medium High Categories included in existing or planned specialty books Category Attractiveness Recommended additional specialty book venture The Fit vs. Attractiveness Model Fit vs. Attractiveness Model Summary The Fit vs. Attractiveness Model optimizes strategy by developing a sense of the realistic state of the market and company affairs. The Model compares product fit with a market to product fit with a company’s objectives.
Fit vs. Attractiveness Model When to Apply The Fit Vs. Attractiveness Model is used to analyze a new product or service offering’s fit within a company, in comparison to the overall attractiveness of the product or offering. This particular model requires judgements which are subjective in nature; one should be aware that this model may oversimplify the market situation. Approach Step 1 Identify product, category or market overall attractiveness as being low, medium, or high. Plot along x-axis. Step 2 Identify product category, or market fit with company objectives as being low, medium, or high. Plot along y-axis. Step 3 Evaluate newly created matrix; aim to reveal products, categories, or markets that fall under high overall attractiveness and high fit with company objectives.
Fit vs. Attractiveness Model Citations - Client and Industry Experience Source List • Paul Elkin, “Mastering Business Planning and Strategy: The Power and Application of Strategic Thinking” • Henry Mintzberg, James Brian Quinn, Sumantra Ghoshal, “The Strategy Process” • Galileo/Travel/ Spencer Lin & Vasu Krishnamurthy • PwC MCS/Consulting/Vasu Krishnamurthy
Five Forces Analysis Five Forces Analysis Summary The Five Forces Analysis evaluates the attractiveness of an industry. DRIVERS OF MARKET ATTRACTIVENESS • POTENTIAL ENTRANTS • Entry barriers are high if there are: • Economies of scale • Product differentiation • Capital requirements • Limited access to distribution channels • Restrictive government policies • Potential retaliatory reaction of incumbents • BUYERS • Bargaining power of customers is greater if: • The customer group is concentrated or buys in large volume • Products purchased are undifferentiated • Products purchased represent a significant portion of the customer's cost • Customers earn low profits, creating incentive to lower purchasing costs • The product purchased is unimportant to the quality of the customer's product • Switching costs are low • Customer group poses a credible threat of backward integration • SUPPLIERS • Bargaining power of suppliers is greater if: • The supply industry is dominated by a few companies or is more concentrated than the buying industry • The supply product is differentiated or there are high switching costs • There are few substitutes • The buying industry is not an important customer of the supply industry • The supply industry poses a credible threat of forward integration • INDUSTRY COMPETITORS • Rivalry is intense if: • Competitors are numerous or roughly equal in power or size • Industry growth is slow • There are high fixed costs or the product is perishable • The product lacks differentiation or switching costs • Capacity is augmented in large increments • Exit barriers are high • Rivals are diverse in strategies, origins, and "personalities" • SUBSTITUTES • Threat of substitutes is high if: • There is an abundance of products or services that serve the same function • The price-performance tradeoff of substitutes is attractive
Five Forces Analysis When To Apply Use the Five Force analysis to evaluate a market’s structure and the trends affecting a market’s profitability. Please note that the structural conditions alone do not provide a quantification of total future market profitability or the viability of a company. Therefore, it is important to integrate company specific insights and confirm that the model accurately reflects what is happening in the market. Approach • Five Forces analysis utilizes a four step approach and is applied as a starting point for understanding a market’s attractiveness: • Step 1: Collect data • Step 2: Evaluate strength of key forces, including: (What about technology?) • Buyers • Suppliers • Substitutes • Competitors • Potential entrants • Step 3: Qualitatively assign a high, medium or low score to each key force • Step 4: Assess the overall effect of the forces on industry attractiveness and strategic implications
Five Forces Analysis Citations - Client and Industry Experience Source List • Aerospace & Electronics Alliance/Multi-Industry/KIT database • Galileo/Travel/ Spencer Lin & Vasu Krishnamurthy • Iberdrola and Johnson & Johnson/TC-Utilities/KIT database • la Caixa/FM-Banking/KIT database • Levi Straus, Merk and Motorola/Multi-Industry/KIT database • PwC MCS/Consulting/Vasu Krishnamurthy • David P Baron, “The Nonmarket Strategy System”, Sloan • Management Review, Fall 1995 • Liam Fahey, Robert M. Randall, “The Portable MBA in • Strategy” • Robert M. Grant, “Contemporary Strategy Analysis”, 3rd • Edition
Mar Apr Scheduled ID Name Finish 3/14 3/21 3/28 4/4 4/11 4/18 4/25 1 Mobilization 3/26/93 2 PwC Mobilization 3/26/93 3 SCM Mobilization 4/23/93 Design customer 4 4/12/93 service process Map communication 5 3/30/93 Model economic 6 4/1/93 decisions Identify cost 7 4/5/93 drivers Identify value 8 4/7/93 drivers Specify CS 9 4/8/93 activities Specify CS information 10 4/9/93 needs Specify CS 11 4/12/93 resource Prepare training 12 4/19/93 materials GANTT Chart GANTT Chart A GANTT chart gives the expected timeline for the engagement based on the client’s needs and our experience and expertise.
GANTT Chart When To Apply When it is necessary to Illustrate for the client a rough timeline for the proposed engagement. Approach • Determine the approximate duration for each task. • Understand the prospective client's time constraints. • Using a project management software tool such as Microsoft Project, determine the specific timeline for the project • Work either forward from an anticipated start date to determine the approximate time of completion, or backward from a client's "must-complete-by" date to determine the necessary duration of tasks, or both
GANTT Chart Citations - Client and Industry Experience Source List • Henry Mintzberg, James Brian Quinn, Sumantra Ghoshal, “The Strategy Process” • Chrysler/Automotive/Vasu Krishnamurthy • E.B.Eddy - Forestry & Wood Products Division/Agriculture, • Forestry & Fisheries/KIT database • Giddings & Lewis/Machine Tool/Vasu Krishnamurthy • RBMG/Mortgage Banking/Vasu Krishnamurthy • United Airlines/Travel/Vasu Krishnamurthy
Gap Analysis Gap Analysis Summary An analysis ranking critical success factors against a company’s ability to attain them and their criticality to succeeding with a particular product or service. Ensure software quality and security EXAMPLE: Negotiate contracts with software vendors and distribution channels Call center adaptation (e.g. 7x24) Source software/agreement Software vendor contacts High Appropriate Internet interface Payment method Evaluate Atlas software Develop product offering mix and marketing expertise (e.g. non-traditional distribution; CD-ROM) High Priority Core Challenge Modify software as needed Market and feasibility assessments CRITICALITY TO PRODUCT SUCCESS Technical support Obtain strong patents Financial projections (marketing) Dongle capability and manufacturing source Quick Hit Lowest Priority Low High DIFFICULTY FOR COMPANY TO ATTAIN Source: PW analysis, industry interviews Source CD-ROM and disks manufacturers
STEP DATA REQUIRED SOURCE(S) 1. Determine the trademark axes for the matrix 2. Determine the company’s existing strategy against the industry 3. Generate alternative strategic options for the company and plot them on the matrix • An understanding of the client’s current positioning, vis-a-vis competitors • Understanding of strategic options available • Interviews with senior management • Analyst reports • Industry experts • Interviews with competitors • Trade publications Gap Analysis When To Apply When you must understand which critical success factors present the greatest challenge in order to focus efforts. Approach Is this the correct text???????????
Gap Analysis Citations - Client and Industry Experience Source List • Flemings Fund Management Ltd (FFML)/Banking/KIT • database • Galileo/Travel/ Spencer Lin & Vasu Krishnamurthy • General Motors/Automotive/KIT database • Philips/Multi-Industry/KIT database • PwC MCS/Consulting/Vasu Krishnamurthy • David A. Aaker, “Developing Business Strategies”, 5th Edition • Robert M. Grant, “Contemporary Strategy Analysis” 3rd • Edition • Michael Gould, Andrew Campbell, Marcus Alexander, • “Corporate-Level Strategy: Creating Value in the • Multibusiness Company”
Data needed for each business unit: • 1. Sales • 2. Market growth • 3. Sales of largest competitor(or market share data) 30% ? STARS QUESTION MARKS Market Growth Rate CASH COWS NO MAN’S LAND DOGS Expected Growth if Available; Otherwise 3-Year Historical Growth Rates 0% 4x 2x 1.5x 1x .5x .25x Company’s Sales or Share Largest Competitors Sales or Share Growth Share Matrix Growth Share Matrix Summary The Growth Share Matrix is examines a company’s portfolio of businesses, depicting the company’s cash flow position by plotting each business’ relative market share against industry growth. This tool assists companies in determining which business units should be a focal point for growth strategies. Two examples of Growth Share Matrices appear below: Each circle represents a different business Circle size represents proportional sales PPO PPO Nat’l Account Local Group Cost Plus and ASO HMO PPO Outstate Direct Pay Comp Medicare Life Market Growth Rate Dental Stand-Alone Traditional/ Comp Local Group Outstate National Account Par National Account Control Traditional/ Comp Local Group Metro 5.0 4.0 3.0 2.0 1.5 1.0 0.7 0.5 0.3 0.2
Growth Share Matrix When To Apply This tool aims to eliminate management distraction in small unprofitable business and guides management to access the appropriate resource levels needed for allocation to promising new businesses/core businesses. Although a useful tool, it has been criticized as being overly simplistic. Market share does not always correlate with profitability and not all businesses have the same asset intensity. Conclusions are sensitive to business and market definitions; where lines are drawn. When using this tool, practitioners should be creative, careful and consistent with market data. Approach • Creating the Growth Share Matrix requires sales data, market growth information and market share data. This information can • be found in the following sources: company data/financial statements, trade publications, interviews with senior management and • industry expert/analyst opinions. The following steps will assist in creating a Growth Share Matrix: • Step 1 Plot relative market share on x-axis • Step 2 Plot market growth rate on y-axis • Use expected growth if available, otherwise use 3 year historical growth rates • Step 3 Each circle (plot) should represent a different business • The size of the circle should be proportionate to sales
Growth Share Matrix Source List Citations - Client and Industry Experience • David A. Aaker, “Developing Business Strategies”, 5th Edition • Robert M. Grant, “Contemporary Strategy Analysis”, 3rd • Edition • John Micklethwait & Adrian Wooldridge, “The Witch Doctors: • Making Sense of the Management Gurus” • Galileo/Travel/ Spencer Lin & Vasu Krishnamurthy • PwC MCS/Consulting/Vasu Krishnamurthy
30% Data needed for each business unit: 1. Sales 2. Market Growth 3. Sales of largest competitor (or market share data) Losing Market Share Market Growth Rate Holding Market Share Each circle represents a different business Gaining Market Share Circle size represents proportional sales 0% Business Growth Rate 30% Use 3-year historical growth rates (use 5-year if business is highly cyclical) Growth Share Matrix Supplement It is useful to accompany the Growth/Share Matrix with a Growth/Growth Matrix, which shows those businesses that are gaining share and those that are losing share. This matrix will often suggest additional analyses, examining the strategy of those businesses losing share.
Industry Value Chain Analysis Industry Value Chain Analysis Summary The Value Chain Analysis can operate on two levels: as a strategic tool to facilitate an understanding of where the key strengths and weaknesses lie within an organization and as a more operational tool to look at supply chain management issues. Limitations include: difficult to estimate where value is created (or destroyed) without more detailed analysis, e.g. ABM, relatively static model, should not be applied in nonmanufacturing or non process oriented companies
Industry Value Chain Analysis When To Apply Understand opportunities for adding value by improving the various elements of the value chain Approach The value chain analysis is at its' simplest a high level diagnostic to see where the organization needs to improve or maintain value creation. Step 1 Identify the key primary and support activities Step 2 Identify value added at each stage Step 3 Assess the contribution of each stage to the organization's competitive advantage Step 4 Identify the key cost drivers Step 5 Assess potential for increasing value and decreasing costs
Industry Value Chain Analysis Source List Citations - Client and Industry Experience • Paul Elkin, “Mastering Business Planning and Strategy: The • Power and Application of Strategic Thinking” • Liam Fahey, Robert M. Randall, “The Portable MBA in • Strategy” • Robert Grant, “Contemporary Strategy Analysis” • Henry Mintzberg, James Brian Quinn, Sumantra Ghoshal, • “The Strategy Process” • Henry Mintzberg, Bruce Ahlstrand, Joseph Lampel, • “Strategic Safari: A Guided Tour Through the Wilds of • Strategic Management” • Galileo/Travel/ Spencer Lin & Vasu Krishnamurthy
? Issue Tree/Issue Map Issue Tree/Issue Map Summary An Issue Tree/Issue Map typically begins with a broad question and defines the sequence of key issues (phrased as yes or no choices) that will support a specific answer. A practitioner would use issue maps to frame options, usually later in the project. A more detailed example is included as a supplement. However, a basic representation can be found below. Issue Map(Yes/No Tree) Yes No
Issue Tree/Issue Map When To Apply This tool is most effective when considering discrete or well-defined alternatives and is extremely practical for communication related issues. A practitioner should be recognize that an Issue Tree/Issue Map requires strong knowledge of problem or issue, client and industry. It can be frustrating to push decision branches to yes/no questions and difficult (time consuming) to create MECE options. Approach An Issue Tree/Issue Map ensures logical integrity of the problem solving framework and reduces potential for oversights or missed opportunities. Follow these 5 steps to successfully create an Issue Tree/Issue Map: Step 1 Identify the key issues Step 2 Define the starting points (i.e. what factors drive these issues?) Step 3 Identify all possible outcomes Step 4 Develop the logic flow connections among these options Step 5 Start over
Issue Tree/Issue Map Citations - Client and Industry Experience Source List • Strategic Change MBA Training • BCBSF/ /Chuck Stern • Galileo/Travel/ Spencer Lin & Vasu Krishnamurthy • United Airlines/Travel/Vasu Krishnamurthy
Issue Tree/Issue Map Supplement Note that this issue map for evaluating an SBU’s strategy sets up six analyses in order. Action Yes Carry on as presently Yes Is client prepared to wait for this? 2 Go to A Will likely movements in prices and demand allow Client to achieve reasonable profitability if it carries on as presently? Analysis No Improve sales and marketing effective-ness by selecting target segments and refocusing efforts Yes A Can client achieve reasonable profitability by better sales and marketing efforts? No 1 Analysis Yes Define and implement profit improvement programs Can client achieve reasonable profitability by reducing its costs? No Define and implement reinvestment program 3 Yes Analysis Would major investment provide client with reasonable profitability? Yes No Dress up for sale Is client worth more to others than to its parents? 4 Analysis No Develop harvest strategy 5 Analysis 6 No Analysis