Download
1 / 12
120 likes | 137 Vues
Conduct a supervised classification to classify the Upper SF Eel River Watershed as forest and non-forest land cover types and estimate riparian canopy for fish habitat quality.

E N D
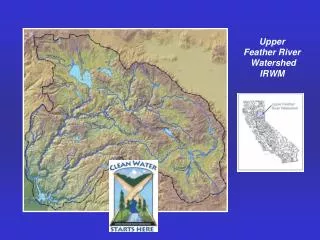
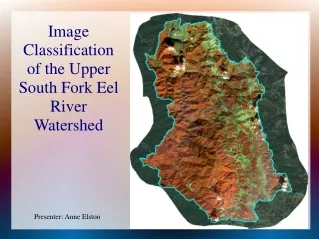
Image Classification of the Upper South Fork Eel River Watershed Presenter: Anne Elston
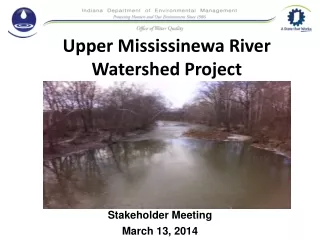
Summary/Purpose • Conduct a supervised classification using the Maximum Likelihood Classification method for the Upper SF Eel River Watershed and classify the watershed as forest and non-forest land cover types. • Eventually use the output to estimate riparian canopy which is one of the factors determined from habitat typing surveys and is used in determining fish habitat quality. The estimation will be used in place of preexisting habitat typing surveys in non-surveyed reaches. Photo of the Upper South Fork Eel River near Branscomb, CA. Photo courtesy of the Coastal Watershed Planning and Assessment Program.
Image Processing • Downloaded TM Landsat 4/5 Individual Bands with less than 10% cloud cover taken on 3/16/2011. • Created a composite image from bands 1-5 and 7. • Clipped the raster using the selected Upper SF Eel Watershed Boundary (source: WBD HUC 10). • Changed the symbology: Setting Band 4 as red, Band 5 as green and Band 3 as blue. Image processing result used as the input for the Supervised Classification.
Supervised Classification • Selected Information Classes • Non-forest • Forest • Selected and Analyzed 80 Training Sites • Used mostly the 1:4K scale to draw training sites. It is generally easier to decipher between the different pixels at this scale. • Visually checked the classification of each training site using the ESRI's Imagery Base Map as a reference and ESRI’s Swipe tool. • Where I was uncertain, I relied on the information from the 2011 National Land Cover Dataset published in 2014. • Checked the histogram of each site and its standard deviation and covariance. The standard deviation and covariance of each training site was relatively low except where there was cloud cover. Training site for non-forest class.
Example: Training Site One of the training sites chosen for the forest land cover type, its histogram, and site statistics.
Supervised Classification Process (Continued) 2 1 3 4
Final Result (Classified image on the right)
Conclusion After each classification, I visually compared each classified image to the original clipped multi-band composite image and to ESRI's Imagery basemap. The fourth and final supervised classification was the best classification and best matched the original image and base imagery. I believe it was the best classification for the following reasons: • Number of training sites (40 of each class). • Variety of training sites and their pixels. • Training sites with different hues were chosen, that is, in areas cast by shadows and by sunlight, and areas that appeared hazy due to a thin layer of cloud cover above. • Training sites were chosen throughout the entire image and not just in one particular area. • The careful selection of training sites in areas that were previously classified incorrectly. • Broad information classes. All of these factors helped me produce a good classification.
Final Training Sites Chosen Original clipped multi-band composite image on the right (input) and the classified image from the fourth and final classification on the right (final output). Both images show the eighty training sites symbolized by class used in the final classification.
Issues Clouds were the biggest challenge in the classification of land cover types. Clouds represented as whitish pixels in the original composite image were classified as non-forest types in the final classified image. There was no way of knowing whether trees exist under these whitish pixels. Since the objective is to determine percent canopy to estimate salmon habitat quality for project planning purposes, having a result which may slightly under-represent the percent canopy is better than if it was slightly over-representing the percent canopy. It seems to be a more conservative output.
Issues (Continued) Overall the classification appeared good but upon careful inspection some of the riparian areas did not appear to be correctly classified. I clipped the resulting classified image using a buffered stream layer using a 60 meter buffer and compared it with ESRI’s Imagery and CDFW’s Habitat Typing Survey results. Comparison of the classified image in the riparian area to the base imagery. There is more forest in the riparian area than what was classified as forest. Confirmed this with the CDFW survey data which states that there is 85.7% canopy density in this reach. 85.7
Potential Improvements: • 1) Rerun the classification on the entire watershed selectively picking training sites in riparian areas or 2) Clip the Image to a 60-meter stream buffer, create a new set of training sites and run the supervised classification on the clipped image. • Redo the classification using NAIP imagery and see if this improves the classification. Further Investigation: • Need to determine how to calculate percent canopy for each stream reach using the classified image and to compare the information to the information contained in the habitat typing survey (available as a vector file) for each stream reach.