Download
1 / 30
300 likes | 541 Vues
This paper is mainly developed for the beginners of Stata software. It will help new users handling data and constructing table.

E N D
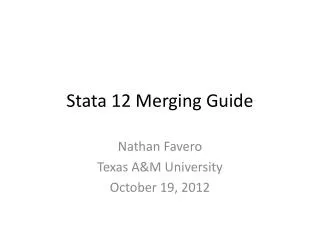
Basics in Stata S. M. Woahid Murad Assistant Professor and Chairman Department of Economics Bangladesh University of Business and Technology (BUBT)
Menu/Icons Variables Window Review Window Result Window Command Window Wednesday, December 23, 2015 S. M. Woahid Murad 2
Wednesday, December 23, 2015 S. M. Woahid Murad 3
Missing Values Missing value Explanation . missing in the raw data .a impossible value / invalid code .b should be skipped according to skip patterns on survey .m other these are used when explicit codes for these .n refused to answer answers were not given, but the surveyor .o not applicable wrote in something that can best classified as such .p don’t know Wednesday, December 23, 2015 S. M. Woahid Murad 4
• Import data from Excel or • Copy data from Excel and paste in Data Editor Click here Wednesday, December 23, 2015 S. M. Woahid Murad
Import Data from SPSS and SAS For SPSS and SAS, you may need to install it by typing ssc install usespss ssc install usesas . ssc install usesas checking usesas consistency and verifying not already installed... installing into c:\ado\plus\... installation complete. Type help usespss or help usesas for more details. Wednesday, December 23, 2015 S. M. Woahid Murad 6
update • update query • update all Wednesday, December 23, 2015 S. M. Woahid Murad 7
help The help screen for any command can be displayed in a separate window with the help command: • Syntax: help command • Example: help spearman Wednesday, December 23, 2015 S. M. Woahid Murad 8
findit The command findit is the best way to search for information on a topic across all sources: • Syntax: findit word • Example: findit anova • Syntex: findit rc # • Example: findit rc 131 Wednesday, December 23, 2015 S. M. Woahid Murad 9
display Oh, calculator? Stata can work as a calculator using the display command. Wednesday, December 23, 2015 S. M. Woahid Murad 10
generate To generate a new variable use the command generate (gen for short), • Syntex: generate [newvar] = [expression] • gen bubt_new=bubt*2 • gen prime_new=prime/2 Some mathematical operators will be Required to get benefit from Stata. For more mathematical operators see help math functions Wednesday, December 23, 2015 S. M. Woahid Murad 11
Some Mathematical operators are: Operation Syntax Operation Syntax Absolute value abs(x) Addition + Square root sqrt(x) Subtraction - Natural logarithm ln(x) Multiplication * Round to nearest whole number round(x) Division / For Example: a) display round(234.43, 1) Power ^ b) gen z=round(x,1) Wednesday, December 23, 2015 S. M. Woahid Murad 12
Logical operators Logic Syntax AND & OR | NOT ! Wednesday, December 23, 2015 S. M. Woahid Murad 13
Relational operators Relation Syntax Relation Syntax Greater than > Less or equal <= Less than < Equal == Greater or >= Not equal != equal Wednesday, December 23, 2015 S. M. Woahid Murad 14
recode • recode deptt (1=1 "Accounting") (2=2 "Economics") (3=3 "Finance") (4=4 "Marketing"), gen (Department) label (Department) • recode sex (0=1 "Female") (1=2 "Male"), gen (Sex) label (Sex) • recode x10 999=.a Wednesday, December 23, 2015 S. M. Woahid Murad 15
generate gen male_act=(Sex==2 & Department==1) gen fem_act=(Sex==1 & Department==1) Wednesday, December 23, 2015 S. M. Woahid Murad 16
Date and time values Initial New For Daily Data gen newt=td(23Dec2015)+t-1 format newt %td For Monthly Data gen newt=tm(2015m12)+t-1 format newt %tm Wednesday, December 23, 2015 S. M. Woahid Murad 17
Date and time values Stata Code Wednesday, December 23, 2015 S. M. Woahid Murad 18
if if can be put at the end of a command in order to use only the data specified. if is allowed with most Stata commands. summarize mt_score mt_score 37 18.05405 5.275446 9 27 Variable Obs Mean Std. Dev. Min Max Variable Obs Mean Std. Dev. Min Max summarize mt_score if mt_score<12 mt_score 4 10 1.154701 9 11 Compare…. summarize mt_score if mt_score<12 & Department==2 Variable Obs Mean Std. Dev. Min Max mt_score 1 11 . 11 11 Wednesday, December 23, 2015 S. M. Woahid Murad 19
egen (extensions to generate) • Syntax egen newvar=fcn(var1) [if] [in] [, options] • Example egen avg_score=mean(mt_score) Wednesday, December 23, 2015 S. M. Woahid Murad 20
keep (the opposite command is drop) keep mt_score Department Sex Initial New Wednesday, December 23, 2015 S. M. Woahid Murad 21
• inspect Syntax: inspect [varlist] [if] [in] Example: inspect mt_score mt_score: MT_Score Number of Observations Total Integers Nonintegers # # # Negative - - - # # # # Zero - - - # # # # # Positive 37 37 - # # # # # # # # # # Total 37 37 - # # # # # Missing - 9 27 37 • codebook Syntax: codebook [varlist] Example: codebook x10 x10 X10 type: numeric (int) range: [6,120] units: 1 unique values: 16 missing .: 0/414 unique mv codes: 1 missing .*: 8/414 mean: 39.0246 std. dev: 15.7835 percentiles: 10% 25% 50% 75% 90% 24 24 36 48 60 Wednesday, December 23, 2015 S. M. Woahid Murad 22
order syntax: order var3 var1 var5 example: order Department Sex mt_score before after sort syntax: sort var1 example: sort mt_score For ascending order: gsort +mt_score For descending order Wednesday, December 23, 2015 gsort -mt_score S. M. Woahid Murad 23
sum var1, d (for summery statistics details) sum mt_score, d MT_Score Percentiles Smallest 1% 9 9 5% 9 9 10% 11 11 Obs 37 25% 14 11 Sum of Wgt. 37 50% 18 Mean 18.05405 Largest Std. Dev. 5.275446 75% 23 25 90% 25 25 Variance 27.83033 95% 26 26 Skewness -.0089143 99% 27 27 Kurtosis 1.781628 Wednesday, December 23, 2015 S. M. Woahid Murad 24
gladder (to check the normality of the series) gladder mt_score Wednesday, December 23, 2015 S. M. Woahid Murad 25
sktest mt_score (for normality test) sktest mt_score Skewness/Kurtosis tests for Normality joint Variable Obs Pr(Skewness) Pr(Kurtosis) adj chi2(2) Prob>chi2 mt_score 37 0.9798 0.0048 7.09 0.0289 Remember: the null hypothesis is the variable is normally distributed In this study, mt_score is not normally distributed. Wednesday, December 23, 2015 S. M. Woahid Murad 26
tab var1 tab Department RECODE of deptt (Deptt) Freq. Percent Cum. Accounting 8 21.62 21.62 Economics 10 27.03 48.65 Finance 10 27.03 75.68 Marketing 9 24.32 100.00 Total 37 100.00 Wednesday, December 23, 2015 S. M. Woahid Murad 27
tab tab Sex Department , sum( mt_score ) Means, Standard Deviations and Frequencies of MT_Score RECODE of RECODE of deptt (Deptt) sex (Sex) Accountin Economics Finance Marketing Total Female 19.333333 15 20.75 19.166667 19.066667 6.1101009 4.2426407 4.0311289 2.7141604 3.9904648 3 2 4 6 15 Male 16 17.875 18.166667 16.666667 17.363636 7.4161985 5.9145704 6.4316924 5.6862407 5.9884449 5 8 6 3 22 Total 17.25 17.3 19.2 18.333333 18.054054 6.7135258 5.5387524 5.4934304 3.7749172 5.275446 8 10 10 9 37 Wednesday, December 23, 2015 S. M. Woahid Murad 28
tab var1 var2, column row tab Department Sex , column row RECODE of deptt RECODE of sex (Sex) (Deptt) Female Male Total Accounting 3 5 8 37.50 62.50 100.00 20.00 22.73 21.62 Economics 2 8 10 Key 20.00 80.00 100.00 13.33 36.36 27.03 frequency row percentage column percentage Finance 4 6 10 40.00 60.00 100.00 26.67 27.27 27.03 Marketing 6 3 9 66.67 33.33 100.00 40.00 13.64 24.32 Total 15 22 37 40.54 59.46 100.00 100.00 100.00 100.00 Wednesday, December 23, 2015 S. M. Woahid Murad 29
tabstat var1 var2 var3, s(mean median sd var count range mi n max) tabstat price income qd qs , s(mean median sd var count range mi n max) stats price income qd qs mean 425 21700 52.5 52.5 median p50 425 21000 52.5 52.5 sd 151.3825 8206.366 15.13825 15.13825 variance 22916.67 6.73e+07 229.1667 229.1667 N 10 10 10 10 range 450 23000 45 45 min 200 10000 30 30 N 10 10 10 10 max 650 33000 75 75 Wednesday, December 23, 2015 S. M. Woahid Murad 30