Download
1 / 30
420 likes | 1.12k Vues
HEAT PROCESSES. HP3. Application of Ts,hs,ph diagrams in refrigeration and cryogenic cycles. Enthalpy, entropy, exergy Balances .

E N D
HEAT PROCESSES HP3 Application of Ts,hs,ph diagrams in refrigeration and cryogenic cycles.Enthalpy, entropy, exergy Balances Isobaric and isoenthalpic processes, choking and Joule Thomson effect in real gases (derivation of JT coefficient). Application of JT effect for liquefaction of gases in Linde process (kryogenics). Enthalpic balances (example: two stage compressor refrigeration, ph diagrams). Entropy and exergy balances. Exergetic losses: choking and heat exchangers. Heat processes design based upon entropy generation minimization EGM (derivation ds/dt). Process integration. Rudolf Žitný, Ústav procesní a zpracovatelské techniky ČVUT FS 2010
T-s, h-s, p-h diagrams (application for refrigeration and cryogenic cycles) HP3 TZ2 Vapor compression refrigeration uses reverse Rankine cycle. Compressor increases pressure of refrigerant vapour (ammonia, freons…). Hot vapours are cooled down in condenser. Liquefied refrigerant expands in the expansion valve (throttle valve) – flash evaporation consumes enthalpy of evaporation that is removed from the cooled media. Absorption refrigeration operates also with the reverse Rankine cycle, but compressor is replaced by an absorber. Refrigerant vapours (e.g. ammonia) are absorbed in liquid (e.g.water) and their pressure is increased by pump (power of pump is very small because it is only liquid). At this elevated pressure the refrigerant vapours are desorbed from liquid by supplied heat. Cryogenics and liquefaction of gases utilise also the expansion valve for temperature decrease, but unlike the refrigeration techniques the refrigerant vapour and not liquid expands in the throttle valve (resulting temperature decrease is caused by the Joule Thomson effect that will be described later). What happened with the refrigerant liquid or vapours when passing through the throttle valve will be discussed next
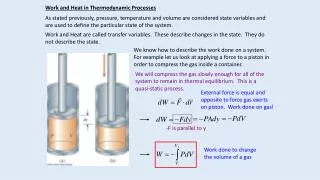
Throttling h=0 HP3 TZ2 Let us assume 1 kg of fluid that flows through a porous plug (or expansion valve), that reduces pressure from p1 to p2 The duct is thermally insulated therefore q = 0. 1 kg of fluid is in front of a plug p1,T1,u1,v1 1 kg of fluid is displaced behind the plug p2,T2,u2,v2 The first law of thermodynamic describes energy balance of this 1 kg of fluid taking into account mechanical work done by the fictive pistons displacing fluid through the plug Internal energy change Mechanical work done by pistons
Compressor refrigeration HP3 TZ2 3 Condenser 3 T Compressor 2 2 Throttle valve important! 1 4 1 4 s Evaporator p 2 3 4 1 h This is the way how your household refrigerator or air conditioning (heat pump-with exchanged roles of condenser and evaporator) operates p-h diagrams are usually used for the compressor refrigeration design Throttling is represented by vertical line in the ph diagram
Multistage compr. refrigeration HP3 TZ2 6 5 p 7 3 4 2 8 1 h Two stage system with medium pressure vessel and common refrigerant. Thermal efficiency is increased. 5 6 7 4 3 2 8 1 Flowrates in first and second stage are different. Ratio of mass flowrates follows from the enthalpy balance of the medium pressure vessel. For thermally insulated vessel (Q=0) holds
Refrigerants HP3 TZ2 • Both the temperature in evaporator and condenser must be between the triple point and the critical temperatures Ttp< T < Tcrit • Refrigerant Ttp Tcrit Tbp pcrit • oC oC oC MPa • Ammonia NH3-78 132 -33 11 • CO2 -80 31 sublimate at atmospheric pressure • R12 -158 112 -30 4 • Cooling capacity kJ/m3determines compressor size (capacity should be as high as possible). • Working pressures are usually between 100 kPa and 2 MPa (according to compressor used). • Freons are prohibited (R12 is CCl2F2, and aggressive radicals of Fluor destroy ozonosphere). Properties of refrigerants are available in databases.
Cryogenics HP3 TZ2 Production, transport and storage of liquefied gases. Such low temperatures can be achieved by using Joule Thomson effect, cooling of a real gas during expansions from very high pressure through throttle valve.
Joule Thomson effect HP3 TZ2 important! What is the temperature of gas after throttling: higher, lower or remains unchanged? Answer depends upon properties of gas and inlet temperature(Joule Thomson effect) From this equation the Joule Thomson coefficientJTcan be expressed as For ideal gas α=1/T and temperature remains constant JT coefficient ispositive ifT>1 (-coefficient of temperature expansion) and only then the temperature decreases with the pressure release. Dependence of the JT coefficient upon temperature is shown in Fig. It is seen that JTis positive at room temperature for most gases with the exception of hydrogen and helium (for them preliminary cooling is necessary). High values of JTare achieved at low temperatures therefore it is always desirable to to cool down gases before expansion.
Cryogenics - Linde HP3 TZ2 1 Multistage compressor with intercoolers 2 2 1 3 important! Throttle valve 4 5 p=200 bar p=1 bar T 6 Separator 3 6 5 4 s Linde-Hampson cycle – final cool down using throttling of precooled gas Liquefactrion of air
Cryogenics -Kapica HP3 TZ2 1 Compressor 1 2 2 3 Detander 4 8 T 3 9 5 4 7 8 6 7 Separátor 5 s 6 Kapicacycle – expansion in turbodetander Throttle valve
Continuous system-balances HP3 TZ2 Hockney
Continuous system-balance HP3 TZ2 Design of thermal units operating in continuous mode is always based upon balances Mass balances (this is quite easy) Enthalpy balances (power consumption, temperatures… sizing equipment) Exergetic balances (enable to estimate measure of irreversibility)
Enthalpy balance HP3 TZ2 Mass flowrate at inlet u, V, p1,u1,dV1 State at time t dQ important! dW u+du, V, +d p2, u2,dV2 State at time t+dt Similar analysis as in throttling. We assume constant volume of system V. During the time increment dt the heat dQ is delivered to the system and the technical work dW is done by the system. Technical work of turbine (e.g.) Mechanical work for inlet/outlet Internal energy change (mass m)
Exergetic balances HP3 TZ2 T 1 important! e s Exergy e [J/kg] is maximum technical work obtainable by transition to the state of environment having infinitely large thermal capacity (e.g. an ocean having temperature Te that remains constant even if heat is supplied or removed from the ocean) . Steady state enthalpy balance (for 1 kg of matter) Exergy Isoentropic expansion Heat absorbed in ocean Exergetic loss analysis of continuous systems enables to find out “weak points” from the point of view of large irreversible losses. losses due to irreversibility
Exergetic balances examples HP3 TZ2 Throttle valve Heat exchanger Heat dq is removed from hot stream at temperature T1 and transferred to cold stream at T2. Entropy of the hot stream decreases and entropy of the cold stream increases T1 dq T2 Assuming no heat losses (dh=0) the exergy losses are Heat transfer surface
Exergetic balances example HP3 TZ2 T 0C T 0C 95 95 90 90 3.7kW 1kW 45 45 40 40 Te=27 Te=27 0.58 0.64 1.2 1.25 s Heat exchanger water/water, mass flowrate in both streams 1 kg/s, hot stream is cooled down from 95 to 900C, cold stream is heated from 40 to 450C. Heat exchangercan be substituted by HEAT PUMP and TURBINECarnot cycles H=21kW Net profit would be 2.7kW of mechanical energy, the same as the exergetic loss of heat exchanger
EGM Entropy Generation Minimization HP3 TZ2 There are always many different design parameters of apparatuses for thermal unit operations (diameters of pipes, fins,…) satisfying specification, e.g. required duty, maximal pressures, temperatures… Optimum is always a compromise, typically trade off between heat transfer and pressure drop (if you increase velocity in a heat exchanger the heat transfer coefficients increase, but at the same time also pressure loss increases). And it is difficult to balance quite different phenomena: thermodynamics and hydraulics. Frequently the specification of free design parameters is a matter of experience, but…
EGM Entropy Generation Minimization HP3 TZ2 EGM is a design concept based upon minimization of irreversible processes. It is a new philosophy: reversible processes are good, irreversible wrong. As a measure of irreversibility the rate of entropy generation in a system is considered. Entropy increase is caused by heat transfer from high to low temperatures (this is always irreversible process) and also by hydrodynamics, by frictional losses (conversion of mechanical energy to heat by friction is also irreversible). These two causes can be summarized for the case of continuous fluid flow (general temperature and flow velocity distribution in space) as Scalar product of viscous stress tensor and gradient of velocity u is power dissipated to heat in unit volume Rate of entropy increase in unit volume Irreversibility due to heat conduction. is thermal conductivity. See also previous expression
EGM Entropy Generation Minimization HP3 TZ2 T T+dT x x+dx Previous equation needs explanation. Let us assume a rod of cross section A, thickness dx, made from material with thermal conductivity . Heat flux is directly proportional to temperature gradient
EGM Entropy Generation Minimization HP3 TZ2 q’ T+T wall temperature x D Tfluid temperature Example: Internal flow in a heat exchanger pipe: Given fluid (viscosity , thermal conductivity …), mass flowrate through a pipe ( ), and heat flux q’ corresponding to 1 meter of pipe, find out the diameter of pipe D giving minimum generated entropy. Rate of entropy generation related to unit length of a pipe is the sum of entropy changes in fluid and environment (in the pipe wall): Entropy increase in fluid Entropy decrease of environment Entropy production in system: pipe+environment Enthalpy balance Remark: You can alternatively derive the same result from previous EGM expression, knowing that the dissipated power [W]
EGM Entropy Generation Minimization HP3 TZ2 For circular pipe (q’ is related to unit length of pipe) Fanning friction factor Nusselt number And substituting to the previous equation Nusselt number Nu and Fanning friction factor f must be evaluated for laminar/turbulent flow regime Minimisation of Sgen givesthe optimal value of Reynolds number This result holds for turbulent flow 2500<Re<1e6 and Pr>0.5 (almost any fluids) See the paper Exergy analysis… by A.Bejan
EGM Entropy Generation Minimization HP3 TZ2 important! Similar analysis can be applied for external flows (flows around sphere, cylinder, fins…). Assuming constant temperature of body TB and constant temperature T and velocity uof fluid far from the surface, the total entropy generation rate can be expressed as FD is drag force therefore FDu is power dissipated to heat Need to know more about EGM? Read the book Entropy Generation Minimization by Adrian Bejan, Frank A. Kulacki (Editor) Crc Press (Oct 1995)
EGM Entropy Generation Minimization Papers HP3 TZ2 just info Susan W. Stewart, Samuel V. Shelton: Finned-tube condenser design optimization using thermoeconomic isolation. Applied Thermal Engineering 30 (2010) 2096-2102 Using a detailed system model as a comparison, this study shows that isolating the condenser component and optimizing it independently by minimizing the entropy generation in the condenser component alone, also known as thermoeconomic isolation, can be a practical way to design the condenser for optimum air-conditioning system efficiency. This study is accomplished by comparing the optimum design determined by maximizing the entire system’s COP, an undisputed method, with the optimum design determined by minimizing the entropy generation in the isolated condenser component, with consistent constraints used for the two methods. The resulting optimum designs from the isolated model produced a COP within 0.6%e1.7% of the designs found by optimizing the COP using an entire system model. A good review of EGM applications (references on papers applying entropy minimization to counter flow HE, cross flow HE, shell&tube HE, finned tube condensers, wavy plate HE, offset strip HE) A model of an air-conditioning system using R-410a as the working fluid was developed in EngineeringEquation Solver (EES) [33]. This model includes a detailed simulation of the components of the air-conditioning system for various designs, including the compressor, finned-tube condenser, evaporator, and expansion valve. The paper doesn’t discuss details of EGM, for me it is only an indicator of the fact that the EGM concept gives similar results as the analysis based upon COP method. Optimized geometrical parameters
EGM Entropy Generation Minimization Papers HP3 TZ2 just info Jiangfeng Guo, Lin Cheng, Mingtian Xu:Optimization design of shell-and-tube heat exchanger by entropy generation minimization and genetic algorithm. Applied Thermal Engineering 29 (2009) 2954–2960 In the present work, a new shell-and-tube heat exchanger optimization design approach is developed, wherein the dimensionless entropy generation rate obtained by scaling the entropy generation on the ratio of the heat transfer rate to the inlet temperature of cold fluid is employed as the objective function, some geometrical parameters of the shell-and-tube heat exchanger are taken as the design variables and the genetic algorithm is applied to solve the associated optimization problem. It is shown that for the case that the heat duty is given, not only can the optimization design increase the heat exchanger effectiveness significantly, but also decrease the pumping power dramatically. In the case that the heat transfer area is fixed, the benefit from the increase of the heat exchanger effectiveness is much more than the increasing cost of the pumping power. the entropy increase by friction the entropy increase by heat transfer the entropy generation number defined by Bejan suffers from the ‘entropy generation paradox’, while the modified entropy generation number avoids such a paradox.
EGM Entropy Generation Minimization Papers HP3 TZ2 just info Lina Zhang,Chun xin Yang, Jian hui Zhou : A distributed parameter model and its application in optimizing the plate-fin heat exchanger based on the minimum entropy generation. International Journal of Thermal Sciences 49(2010) 1427-1436 Temperatures and pressures are calculated in each 3D cell numerically Different optimization methods, for example genetic algorithms are used in the EGM (multi variable minimization of Sgen).
Process Integration Pinch Analysis and Targeting HP3 TZ2 Exergetic analysis enables to identify units (boilers, reactors, heat exchangers, furnaces,…) responsible for major irreversible losses in complicated systems (e.g. processing plants of chemical industry). EGM is concentrated to the engineering design of individual apparatuses. Process integration is technology of a preliminary design of complicated systems (network of heat exchangers) aimed to “optimal” arrangement of thermal units from the point of view of process heat utilisation (internal heat transfer between sources and sinks) and minimization of irreversible heat transfer. Key feature is PINCH analysis (it has nothing to do with dogs). Pinch is a critical point in the network of heat exchanger characterised by the smallest temperature difference (approach) between the hot and cold streams. Tells nothing to you, is it confusing? Read e.g. the short and easy paper Gavin P. Towler: Integrated process design for improved energy efficiency. Renewable Energy, Volume 9, Issues 1-4, September-December 1996, Pages 1076-1080 Need to know more about the process integration? Read papers from Bodo Linnhoff, father of this technology (UMIST Manchester) or the paper of his colleague Klemesh
Process Integration Pinch Analysis and Targeting HP3 TZ2 T 2 1+2 1 H H System is described as a list of apparatuses (reactors, separators, distillation columns, furnaces,…, so far without heat exchangers) connected by streams. Temperatures and flowrates at entries and outlets of apparatuses are specified according to process requirements. First step of process integration consists in generation of a table of process streams. Each stream is characterized by mass flowrate [kg/s], heat capacity, inlet and outlet temperatures and enthalpy flows H [W] which must be added to heated cold streams or rejected from hot streams. Streams are plotted in graph T,H as vectors (lines if the heat capacity of stream is constant). Vectors of hot streams are added together (by adding enthalpy flow changes) giving composite curve T
Process Integration Pinch Analysis and Targeting HP3 TZ2 Hot service requirement T [C] Pinch point Streams below pinch H C Streams above pinch H [W] Heat utilised by heat exchangers Cold service requirement Composite curve of hot and cold streams in T-H diagram (plot of composite curves is obtained by summing enthalpy changes in the table of process streams) • The composite curves can be freely shifted in horizontal direction because H represents only enthalpy flow changes. Moving for example the composite curve of cold streams to the right increases temperature difference between the streams (heat transfer surface of the heat exchangers transferring enthalpy from hot to cold streams will be smaller), but at the same time demands on hot and cold service increases. • Process integration aims to find out a compromise between the amount of utilised processed heat and investment (heat transfer surface of HE). This optimum determines position of pinch point. • Pinch point divides process streams to streams above and bellow pinch and according to this the following simple design rules can be expressed: • Never use hot service bellow pinch • Never use cold service above pinch • Never transfer heat across the pinch
Process Integration Pinch Analysis and Targeting HP3 TZ2 Hot service requirement T [C] T [C] Only a part of hot service is supplied by high pressure steam DTmin Part of hot service delivered by medium pressure steam H [W] Cold service requirement Grand Composite Curve (GCC). GCC serves for alocation of hot/cold services to different utility levels (with the aim to satisfy the process requirement by the lowest possible quality of heat, e.g. using cooling water instead of refrigeration). GCC is created from the composite curve by increasing the cold compositetemperature by ½ DTmin and decreasing the hot composite temperature by ½ DTmin
Process Integration Pinch Analysis and Targeting HP3 TZ2 Try on line web application(written by undergraduate student J.S.Umbach university of Illinois, Chicago 2010) Composite curves Grand composite curves (exchanged axis – enthalpy flow vertical, temperatures and shifted temperatures on horizontal axis, please note that the GCC are simplified – only the composite cold curve is shifted up by DTmin=10)