Download
1 / 31
310 likes | 337 Vues
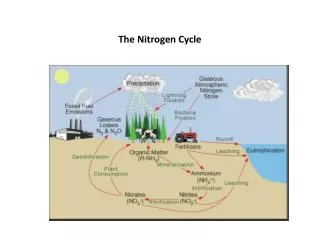
This lecture explores the nitrogen cycle in the ocean, including nitrogen fixation, denitrification, and the global distribution of nitrogen sources and sinks. The lecture also covers the global oxygen and carbon cycles and their relationship to nitrogen.

E N D
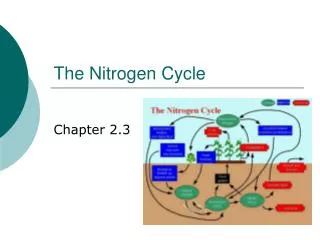
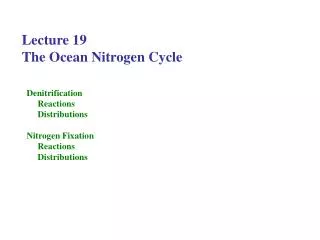
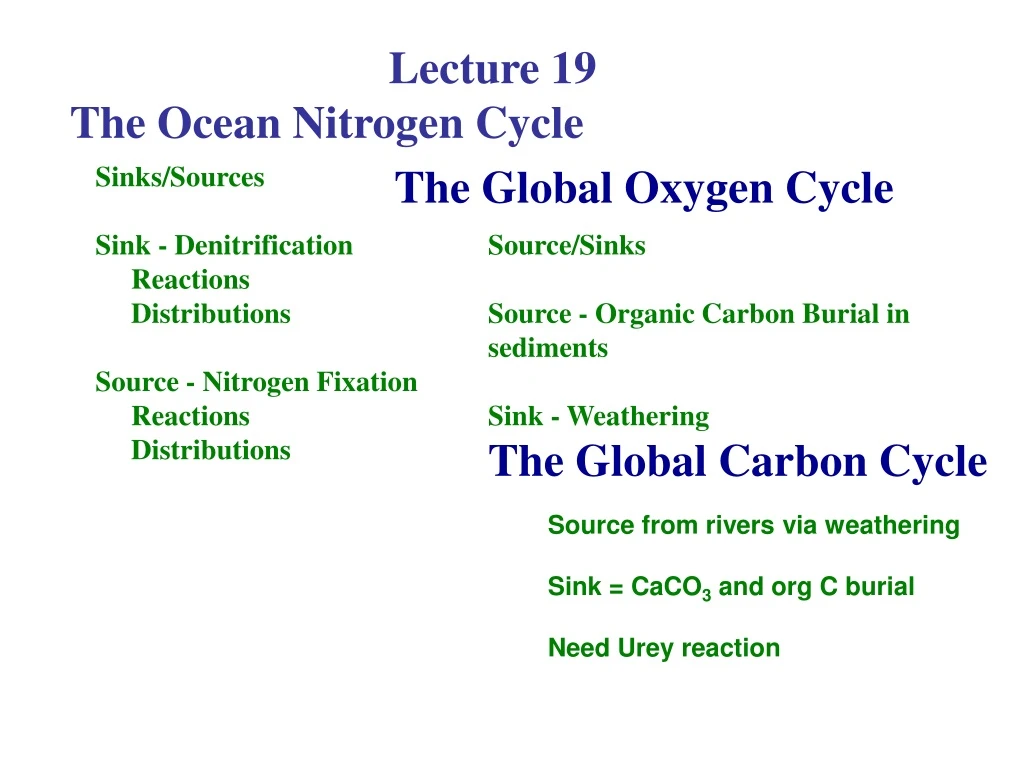
Lecture 19 The Ocean Nitrogen Cycle Sinks/Sources Sink - Denitrification Reactions Distributions Source - Nitrogen Fixation Reactions Distributions The Global Oxygen Cycle Source/Sinks Source - Organic Carbon Burial in sediments Sink - Weathering The Global Carbon Cycle Source from rivers via weathering Sink = CaCO3 and org C burial Need Urey reaction
Main Ocean Source of N Nitrogen Fixation Enzyme catalyzed reduction of N2 N2 + 8H+ + 8e- + 16 ATP → 2NH3 + H2 + 16 ADP + 16Pi Mediated by a two protein (Fe and Fe-Mo) complex called nitrogenase Inactivated when exposed to O2 An excellent example of how paradigms change with time
Main Ocean Sink of N Fixed Nitrogen (NO3-, NO2-, NH4+) is converted to N2 in low oxygen zones of the ocean Two Pathways Denitrification ( <2 to 10 mM O2): 2 NO3- + organic matter → N2 Anammox (<2 mM O2) NH4+ + NO2- → N2 + H2O
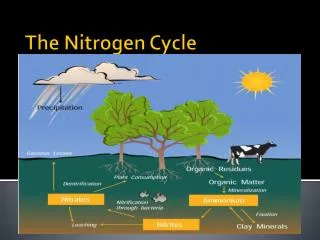
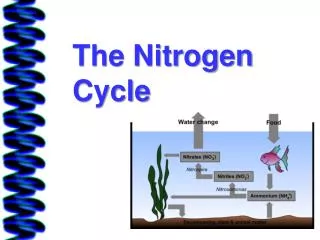
Schematic of Ocean Nitrogen Cycle Gruber (2005) Nature 436, 786
Where are low oxygen zones? Global distribution of O2 at the depth of the oxygen minimum Gruber and Sarmiento, 1997
Spatial Coupling of N sources and sinks (Deutsch et al, 2007, Nature, 445, 163) Also, Capone and Knapp (2007) Nature, 445, 159
Spatial coupling of N2 fixation and denitrification (Model results; Deutsch et al, 2007)
What is N*? How to calculate excess or deficient NO3- The solid line shows the linear equation P = 1/16 N + 0.345 (equivalent to N* = 0) Values to the right have positive N*, to the left have negative N* N* is defined as N* = [NO3] – 16 x [PO4] +2.9 PO4 versus Nitrate (GEOSECS data) Insert shows the effect of nitrification, photosynthesis, N2 fixation and denitrification.
Vertical distribution of N* N2-Fix denitrif excess deficit N* is defined as N* = [NO3] – 16 x [PO4] +2.9
Map View of N* N* at 200m in the Pacific (Gruber and Sarmiento, 1997)
N* on density of 26.5 Ryabenko 2013 Topics in Oceanography
Why is N* negative – two sinks Nitrogen Cycle w/ anammox and denitrification Kuypers (2003) Nature 422: 608-611.
Nitrogen species: NO3- ; NO2- ; N2O; N2 ; NH4+ (V) (III) (I) (0) (-III) Nitrogen Isotopes: 14N 99.634% 15N 0.366% Isotopic Composition: ‰ The standard is atmospheric N2
Fractionation factors , where e is the isotopic enrichment factor Fractionation Heavier stable isotope forms stronger bond. Microbial Enzymes break light isotope bonds more easily. Reactants become heavier (enriched) (e.g. NO3-→ N2) Products become lighter (depleted) Partial versus total reaction (products have same values as reactants)
The Global Nitrogen Budget-one example (Brandes et al, 2002) Ocean could be at SS or not!
Why is this important for chemical oceanography? What controls ocean C, N, P? g ≈ 1.0 Mass Balance for whole ocean: C/ t = VRCR – f B CS = 0; CD = CD VU = VD = VMIX Negative Feedback Control: if VMIX↑ VUCD↑ B ↑ f B ↑ (assumes f will be constant!) assume VRCR then CD↓ (because total ocean balance VUCD↓ has changed; sink > source) B ↓ The nutrient concentration of the deep ocean will adjust so that the fraction of B preserved in the sediments equals river input! CS CD if VMIX = m y-1 and C = mol m-3 flux = mol m-2 y-1
Atm Input (25) Nitrogen Balance N2 Fix (110-330) VRCR (25) B Denitrification sed = 200-280 wc = 75 Net fluxes = -200 to 0 (sink > source; non-SS??) fB (25) Fluxes in Tg N y-1 Brandes et al 2002
Earth is overall reducing Separate O2; sequester reducing material The Global Oxygen Balance Large O2 linked to Small C As P = R, O2 not affected by DP tO2 = 4 my solar UV only non-cyclic only w/o biology P and R in balance accelerated weathering Small imbalance in P-R marine org C only, not terrestrial tC = 20yr 80% in hemipelagic sediments where %orgC = 0.5% orgC includes H2S and Fe(II) tC = 108 yr stoichiometric so use moles Present is key to past Walker (1974) AJS
1) If P ceased and R continued org C would be consumed in 20 yr O2 would decrease by 1% 2) If the only sink is weathering, O2 would go to 0 in 4 my. This is a short time geologically so controlling balance must to strong. 3) Control on O2 = org C burial (O2 source) vs weathering (O2 sink) 4) Feedback mechanism if atm O2 anoxic ocean org C burial atm O2 5) Control is with source rather than sink Sedimentary org C reservoir has not changed with time
Hemipelagicsediments (org C > 0.5%) 200m to 3000m 80% of sediment orgC
The long-term global carbon balance weathering CaCO3(s) + CO2(g) + H2O = 2HCO3- + Ca2+ 2HCO3- + Ca2+ = CaCO3(s) + CO2(g) + H2O deposition A better example of reverse weathering! Fig. 2.5 Emerson and Hedges
Chemical Weathering, the Geological Carbon Cycle, Control on CO2 1. CO2 is removed by weathering of silicate and carbonate rocks on land. 2. The weathering products are transported to the ocean by rivers where they are removed to the sediments as CaCO3 and SiO2. 3. When these sediments are subducted and metamorphosed at high T and P, CaCO3 and SiO2 are converted into CaSiO3 and CO2is returned to the atmosphere. Ittekkot (2003) Science 301, 56 For more detail see Berner (2004) The Phanerozoic Carbon Cycle: CO2 and O2. Oxford Press, 150pp.
TABLE 2 Oceanic fluxes of carbon Flux Atmospheric Demand River input 43.2 Derived from atmosphere 35.0 -35.0 Derived from carbonates 8.7 Hydrothermal input 0.5 Carbonate deposition 49.4 Deposited as carbonates 24.7 Lost to atmosphere 24.7 +24.7 Net atmospheric demand -12.4 Units: 1012mol/y Some CO2 produced by carbonate deposition, but not enough! The rest must come from the Urey reaction. From McDuff and Morel (1980)
There must be a tight feedback control on atm CO2 1. The problem of the cool sun (Sagan and Mullen, 1972). Solar luminosity has increased by 25% over the age of the solar system. But liquid water has existed for 3.8 byr! There must be a temperature buffer! 2. Was it NH3?? No. Most likely the greenhouse gas CO2. 3. CO2 is produced to the atmosphere by volcanoes and metamorphism. Such as The “Urey Reaction” CaCO3(s) + SiO2(s) = CaSiO3(s) + CO2(g) 4. The important sink of CO2 is weathering of silicate minerals. Weathering of silicate rocks consumes CO2 and produces Ca2+ and Mg2+ to rivers. In the ocean this Ca2+ and Mg2+ is removed by formation of carbonate rocks which produces CO2. The rate of weathering is influenced by rock type, slope, temperature and runoff 5. The weathering and deposition of carbonate rocks alone is not sufficient. Need the Urey Reaction! 7. A negative feedback. If the earth became cooler, silicate weathering would decrease, atmospheric CO2 would increase and the earth would warm!
% of Export Production (as N) at HOT derived from N2 Fixation (N-P mass balance model of Karl et al (1997) Nature 388, p. 533)
Spatial coupling of N2 fixation and denitrification (Deutsch et al, 2007)
The Global Nitrogen Budget-one example (Brandes et al, 2002)
Downcore records of 15N-orgN from several sites High values of 15N-OrgN suggest more extensive denitrification Deutsch et al, 2004)