Rationale
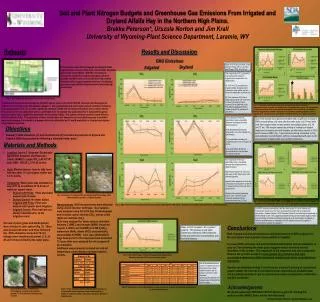
Soil and Plant Nitrogen Budgets and Greenhouse Gas Emissions From Irrigated and Dryland Alfalfa Hay in the Northern High Plains. Brekke Peterson* , Urszula Norton and Jim Krall University of Wyoming-Plant Science Department, Laramie, WY. Rationale. Results and Discussion. GHG Emissions.

Rationale
E N D
Presentation Transcript
Soil and Plant Nitrogen Budgets and Greenhouse Gas Emissions From Irrigated and Dryland Alfalfa Hay in the Northern High Plains.Brekke Peterson*, Urszula Norton and Jim Krall University of Wyoming-Plant Science Department, Laramie, WY Rationale Results and Discussion GHG Emissions Major GHG fluxes occurred in two phases: Phase 1(P1)- 0 to 6 hrs and Phase 2 (P2)- 6 to 72 hrs. Dryland Irrigated In the Northern High Plains irrigated and dryland alfalfa hay production are one of the main economically important agricultural commodities. With the increasing re-occurrence of intensive summer droughts and more sporadic rainfall events, it is unclear how high climate variability affects agroecosystem services of mitigating greenhouse gas (GHG) emissions while sustaining high productivity. a b The magnitude of CO2 production was significantly greater in irrigated soils compared to the dryland soils. P1: At 3 hrs, CO2production in irrigated alfalfa and grass plots following a water pulse was two times the magnitude of prewet soil. P2: The maximum CO2 flux in dryland grass plots was over twice the level of prewet soil and occurred 24 hrs after the pulse. The dryland alfalfa plots had a couple of small CO2 pulses at 3 and 48 hrs. Fig. 1: 2010 Alfalfa hay production in the Northern High Plains. c d To address this question we simulated a rainfall/irrigation pulse and monitored GHG emissions and belowground carbon (C) and nitrogen (N) mineralization dynamics. We hypothesized that under water-pulsed conditions following prolonged periods of no rain or water, significant amounts of GHG will be released. However, more carbon dioxide (CO2) and less nitrous oxide (N2O) will be contributed from the dryland hay production that is dominated by grass species compared to irrigated hay production dominated by alfalfa. This system will also become a more effective sink for methane (CH4). The magnitude of these contributions will depend on soil microbial response to available water and subsequent biochemical processes driven by differential soil C and N availability in irrigated and dryland hay production systems. Fig. 6: Potentially mineralizable nitrogen (a), soil ammonium (b) and nitrate (c) concentrations from irrigated and dryland plots following the water pulse. Net accumulation of ammonium and nitrate in resin capsules excavated at 72 hours after infield incubation. Statistical significance at alpha= .05 (student’s t-test) when comparing irrigated and non-irrigated plots. Life forms (grass and alfalfa) are lumped together for irrigated and dryland sites. The magnitude of the CH4 assimilation was comparable between the irrigated and the dryland system. Soils beneath legume plants appeared to have the highest CH4 assimilation. CH4assimilation increased in irrigated plots at 3 hrs and again at 48 hrs. CH4 assimilation declined in dryland plots at 6 hrs and then increased at 48 hrs. Soils from dryland sites (grass-dominated) had a significant increase in PMN concentrations only once after the water pulse ( at 24 hrs), while soils from irrigated sites showed smaller but multiple pulses at 3, 24 and 72 hrs. This may be caused by priming of residual soil organic matter and increased microbial biomass as reflected by decline in DOC and increase in MBC (Fig. 7) and microbial activity. Immediate (3 hrs) ammonification and nitrification (48 hrs) corresponded with resin net N accumulation (irrigated plots only) and N2O production . Objectives • Assess (1) GHG emissions, (2) soil microbial and (3) biochemical properties of dryland and irrigated alfalfa hay production following a simulated water pulse. Materials and Methods • Location: James C. Hageman Sustainable Agriculture Research and Extension Center (SAREC), Lingle, WY, (LAT 42º14” and LONG -104º35”), 1217.93 m elev. • Soils: Medium texture- loam to silty loam with less than 1% soil organic matter and 1-3 % CaCO3. • Treatments: Water pulse was simulated in July 2011 as an addition of 10.5 mm of water per square meter. • Dryland with Pulse: Plots were hand watered with DI water. • Dryland Control: No water added. • Irrigated with Pulse: Plots were watered with quarter pivot irrigation. • Irrigated Control: Plots had rain-out shelters installed prior to the irrigation event. • Six sets of pairs (grass and alfalfa plants) were selected in each system (Fig. 2). Three were pulsed with water and three remained dry. GHG emissions and soil (0-10 cm) changes were monitored at prewet, 3, 6, 24, 48 and 72 hours following the water pulse. The magnitude of the N2O assimilation was comparable between the irrigated and the dryland system. High N2O production at 3 hrs and after was mostly observed in soils beneath legumes. Irrigated sites appeared to have two consecutive N2O pulses at 3 and 48 hrs (legume plots) and 6 and 48 hrs (grass plots). Dryland plots started producing N2O at 3 hrs. The N2O levels remained elevated until the experiment was over (72 hrs). A b a Fig. 2: Examples of irrigated (left) and dryland (right) plot setup. Note alfalfa density is greater in irrigated system. c d Fig. 7: Soil DOC (a), DON (b), MBC (c) and MBN (d) concentrations from irrigated and dryland plots following the water pulse. Life forms (grass and legume) are lumped. Measurements: GHG measurements were obtained using closed chamber technique. Gas samples were analyzed using GC-2014 Gas Chromatograph and included carbon dioxide (CO2), nitrous oxide (N2O) and methane (CH4). Soils were analyzed for water content, microbial biomass C (MBC) and nitrogen (MBN), dissolved organic C (DOC) and N (DON) (in 0.5M K2SO4), ammonium (NH4), nitrate (NO3) and potentially mineralizable N (PMN). Ionic resin (Amberlite®) bags buried prior to the experiment and excavated 72 hours after were analyzed for net inorganic N accumulation. Additional measurements included soil and air temperature, plant biomass and plant species density. Fig. 4: GHG emissions from irrigated and dryland systems following the water pulse. Emissions are broken down by life form: alfalfa and grass. Soil MBC increased immediately after the water pulse (3 hrs) in dryland soils reaching the maximum at 24 hours and stayed elevated until the experiment termination. Notable decline in DOC between 6 and 24 hrs following the pulse and in DON between 3 and 6 hrs suggested possible priming of soil residual organic matter and immediate microbial immobilization (dryland) and mineralization (irrigated) as reflected by differences in magnitude of GHG emissions and soil inorganic N concentrations between the systems. Conclusions Water content increased ~8% in pulsed systems. This increase in soil water content was reflected in GHG emissions, nitrate and ammonium concentrations, and microbial biomass. Both irrigated and dryland systems are important sources of GHG emissions to the atmosphere upon summer intense rainfall or irrigation. Increased GHG emissions and soil microbial immobilization and mineralization as early as 3 hrs following the water pulse suggests similar microbial activity regardless of the system. The magnitude of the responses was also comparable between the systems except for much greater CO2 production and resin accumulated ammonia in alfalfa-dominated irrigated plots which contradicted our hypothesis. Possible mechanisms of labile C and N release include (1) priming of residual soil organic matter, (2) turnover of microbial biomass responding to available water and microbially available C and (3) enhanced microbial mineralization, nitrification and N2O production. Fig. 5: Gravimetric water content of irrigated and dryland plots. Sampling took place 72 hours post-water pulse. Soil air temperatures were cooler in irrigates sites than the dryland sites. Water addition lowered the air temps 6 and 24 hrs after the pulse. Control plots had lower soil temperatures 24 and 48 hrs after the pulse. A B Acknowledgments Table 2: Average air and soil temperature by time and plot in irrigated and dryland systems plus or minus standard error. Fig.3: Study pictures. A: Alfalfa and Orchardgrass example from irrigated system. B: T0 extraction evening of July 17, 2011. Table 1: Plant biomass, alfalfa and grass plant densities in irrigated and dryland systems. Note: alfalfa density is greater in irrigated system, while grass density is greater in dryland plots. We greatly appreciate AFRI NIFA CAPS Preparatory grant for funding this project and the SAREC farm crew for their hard work. Contact: Brekke Peterson (bpeter28@uwyo.edu)