Download
1 / 13
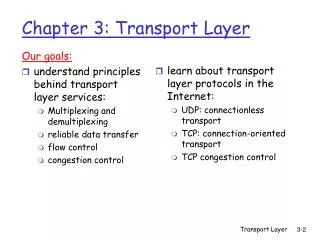
130 likes | 280 Vues
Transport of Pollutants Through Liquid-Gas Interfaces – a Numerical Approach Principal Investigator: Urmila Ghia Graduate Students: Aravind Kishore, Santosh Konangi Computational Fluid Dynamics Research Lab (CFDRL) University of Cincinnati Cincinnati, OH 45221 NIOSH-ERC

E N D
Transport of Pollutants Through Liquid-Gas Interfaces – a Numerical Approach Principal Investigator: Urmila Ghia Graduate Students: Aravind Kishore, Santosh Konangi Computational Fluid Dynamics Research Lab (CFDRL) University of Cincinnati Cincinnati, OH 45221 NIOSH-ERC 10th Annual Pilot Research Project (PRP) Symposium October 1-2, 2009
OUTLINE • Motivation • Objectives of Present Study • Problem Description • Steps in Solution Procedure • Results • Future Work
MOTIVATION • MOTIVATION: • Carbon Monoxide (CO) is ejected in the exhaust of combustion-based systems, e.g., watercraft. • Being lighter than water, CO rises to water surface behind boat, • Gets entrained into the cabin due to “Station-Wagon effect”. • Tests conducted by NIOSH show high CO concentration in back deck and cabin. • Marine workers are exposed to high concentration of CO – higher than Immediately Dangerous to Life and Health (IDLH) value of 1200 ppm. • PREVIOUS RESEARCH CONDUCTED AT CFDRL: • Studied dispersal of exhaust gases under the hull of a watercraft by modeling the water surface as a slip boundary. • Effect of free surface on exhaust dispersal was not considered. Station-Wagon effect, Courtesy: www.boat-ed.com Transport of CO in water and across water-air interface
OBJECTIVES • Understand the flow physics involved in the transport of pollutants through an air-water interface. • Develop a Computational Fluid Dynamics (CFD) model to simulate this flow physics. • Accurately predict pollutant transport into air above the water surface by considering a unit process involving the pollutants and the air-water interface.
PROBLEM DESCRIPTION Schematic of simulation domain • Cylindrical vertical column: • Height: 2m • Diameter: 0.2m. • Static height of water column: • Hwater: 1m. • Mixture composition at inlet: • Volume Fraction of CO: 0.5 • Volume Fraction of Water: 0.5 • CO bubbles, of diameter of 0.5 cm, flow in through the bottom, with a velocity of 0.1 m/s. • Atmospheric pressure at top of air column.
STEPS IN SOLUTION PROCEDURE • Unsteady Incompressible Navier-Stokes equations are solved. • Eulerian Multiphase model is used, treating phases as interpenetrating continua. • Primary phase: Water • Secondary phases: Air and CO • “Virtual mass effect” term included in the momentum equations for both phases – accounts for inertia of primary-phase mass encountered by the accelerating bubbles. • Schiller-Naumann drag model is used. In definition of CD , the Reynolds number uses the magnitude of the velocity of the primary phase relative to that of the secondary phase. Acceptable for use with all fluid-fluid pairs. • Turbulence is modeled using the mixture k-ε equations.
STEPS IN SOLUTION PROCEDURE (Cont’d) • Pressure-velocity coupling is achieved using the Phase-coupled SIMPLE algorithm. • Velocities are solved coupled by phases, but in a segregated fashion. • Pressure correction based on total volume continuity. • Second-order upwind scheme is used to discretize convection terms. • The finite-volume flow solver FLUENT is used. • Grid in r and z directions: 30x300. • Time step: 0.0001 seconds. • The solution at each time-step is assumed converged when scaled residuals of continuity and momentum conservation equations reach the order of 10-3. • Simulation is continued until CO exits the column, i.e., for approximately 48 seconds.
RESULTS Transient CO motion along the vertical column • Key observations about CO behavior: • CO gas enters in the form of bubbles, and rises to air-water interface. • CO gas traverses water domain in approx. 15 secs to reach the air-water interface, owing to substantial driving force. • Slow dispersal of CO in the air; CO takes approx. 35 secs to reach top of air column.
RESULTS (Cont’d) General Observations about Air, Water and CO Volume Fractions • Rapid CO dispersal in water domain: • Large density difference : CO is 1000 times lighter than water. • Initial momentum. • Fractional increase in the level of the air-water interface as CO-water mixture enters the vertical column. • CO bubbles rupture at air-water interface, and CO gas is freely dispersed into air region. • Slow dispersal of CO in air domain: • Milder density difference: CO is only marginally lighter than Air. • Loss of initial momentum due to liquid drag. Volume Fraction Contours at t=48 seconds.
CONCLUSIONS • Rapid CO movement through water domain – due to initial momentum and large density difference between water and CO gas. • At the air-water interface – CO bubbles rupture, and CO gas is freely dispersed into the air. • Milder density differencein the air domain – much slower dispersal rates compared to CO movement in the liquid region. • Air-water interface inadequately resolved.
FUTURE WORK • Enhance problem geometry to include a watercraft and its surrounding environment. • Devise methodology to adequately capture the air-water interface. • Explore methods to capture wave motion at the air-water interface, and the corresponding effect on the motion of the gas crossing the interface.
HOW DID PRP HELP US?! • KEY OUTCOMES: • Developed a deeper understanding of Multi-phase and Multi-species flow phenomena. • Extended the use of Computational Fluid Dynamics to applications in Environmental Health and Occupational Safety. Numerical Simulation of Pandemic Flu Dispersal in an Airborne Infection Isolation Room (AIIR)
ACKNOWLEDGEMENTS • National Institute for Occupational Safety and Health (NIOSH), Cincinnati, Education and Research Center (ERC). • Dr. Amit Bhattacharya, Environmental Health, College of Medicine, UC. • ERC Staff.