
Analyzing Overall Equipment Efficiency Rates
E N D
Presentation Transcript
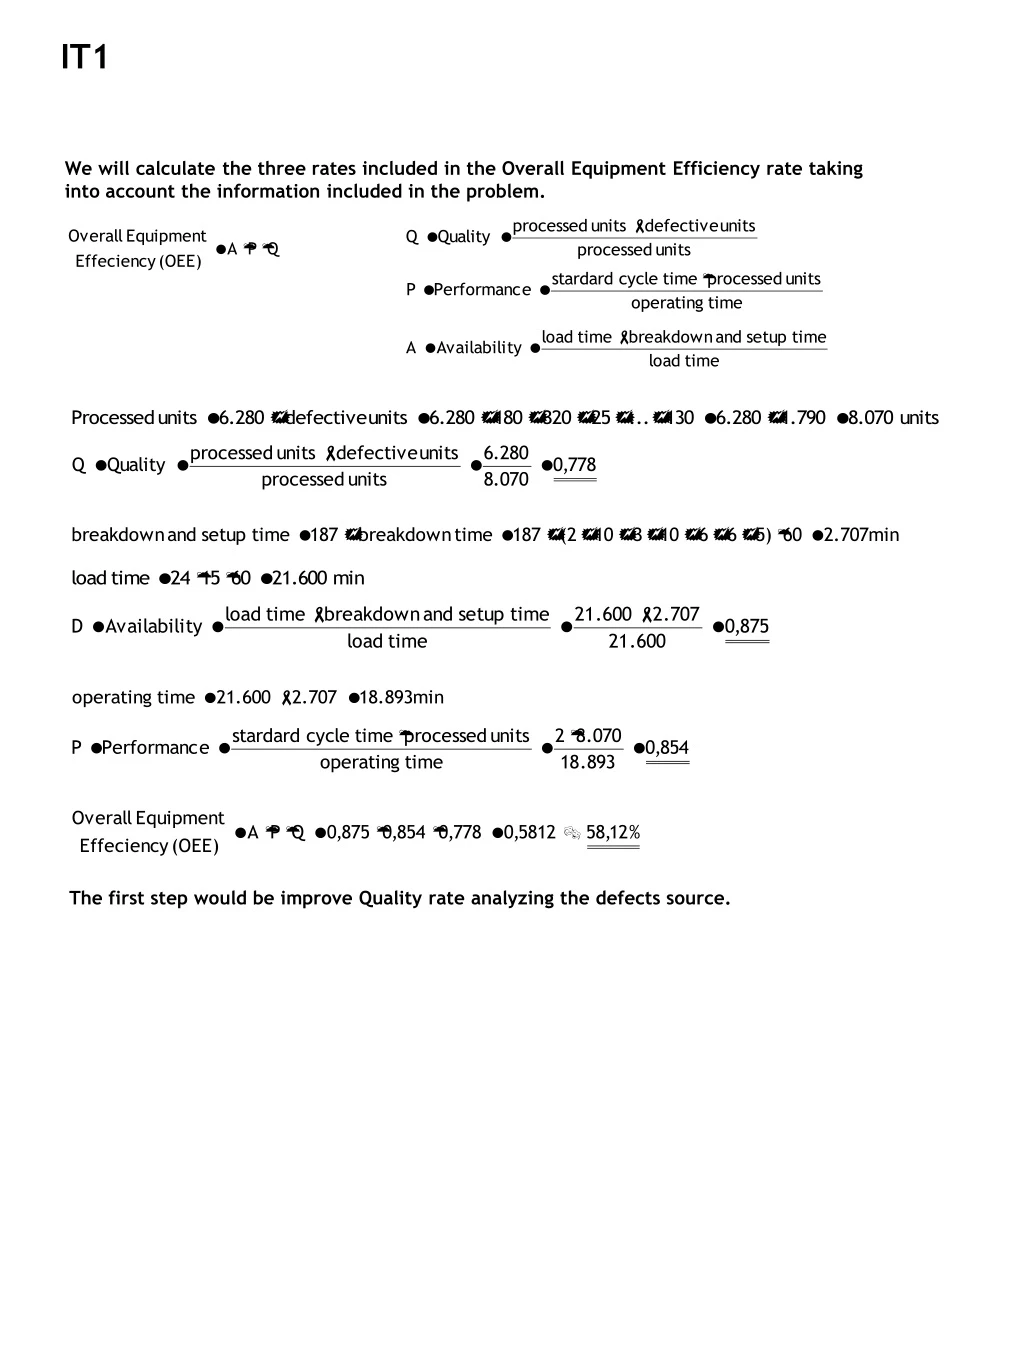
IT1 We will calculate the three rates included in the Overall Equipment Efficiency rate taking into account the information included in the problem. The first step would be improve Quality rate analyzing the defects source.
IT2 The problem is very similar (almost identical) to the Problem nº IT1.The only difference is that the production corresponds to the total production instead of the correct production. We will calculate the three rates included in the Overall Equipment Efficiency rate taking into account the information included in the problem. The first step would be improving Performance rate analyzing the working cycle and the idle time sources.
IT3 The problem is very similar “almost identical” to the Problem nº IT2.The only difference is that there is a 8 hours planned stop. As a result, the load time decreases. We will calculate the three rates included in the Overall Equipment Efficiency rate taking into account the information included in the problem. The first step would be improving Quality rate analyzing the defects source.
IT4 First step: consists on transforming the problem data into the variables included in the OEE formula. Then, the OEE rates in both situations (BEFORE and AFTER) can be calculated. Calendar time = 10 days · 8 h = 80 h BEFORE Planned stops 6 hours Load time = 80 – 6 h operating time 400 defects breakdown = 4 h setup = 6 h 20.280 units (2.800 u/d theoretical)
IT4. cont Calendar time = 10 days · 8 h = 80 h AFTER Planned stops 6 hours Load time = 80 – 6 h operating time 100 defects breakdown = 5 h setup = 6 h 20.100 units (2.800 u/d theoretical) The figure shows how SMED methodology has not changed the breakdown and the setup time. However, the number of defects do change. Before explaining SMED effects we will calculate the OEE rate. • OEE rate has hardly changed, but this does not means that the SMED has been inefficient. • The result is coherent with SMED methodology, as can be seen in the SMED chapter. SMED can be applied to achieve flexibility. As a result, the setup total time does not vary but, the time of each change decreases and the Availability rate does not vary. • SMED methodology eliminates testing procedures and adjustments. As a result, the defects produced in these steps are reduced or eliminated.
First step: consists on transforming the problem data into the elements included in the OEE formula. Then, the OEE rates in both situations (BEFORE and AFTER) can be calculated. Calendar time = 10 days · 24 h = 240 h BEFORE planned stops 0 hours Load time = 240 h Operating time breakdowns = 2+5+2+3 = 12 h setups = 2+1+2+2+2+3+4 = 16 h 100+150+…+200 = 1.470 defects 12.000+13.280+…+11.700 = 124.680 units (14.500 u/d theoretical) IT5
Calendar time = 10 days · 24 h = 240 h planned stops 0 hours Load time = 240 h Operating time breakdowns = 3+4+4+1 = 12 h setups = 3+2+2+3+2+2+2 = 16 h 200+250+…+180 = 1.875 defects 15.000+13.200+…+14.900 = 146.200 units (20.000 u/d theoretical) • The OEE rate has decreased. • Productivity has increased, that is to say, it is possible to produce more parts in a working day. Quality and Availability hardly vary. Nevertheless, idle time increases. As a consequence, performance rate decreases as well as the OEE rate. IT5. cont
IT6 First step: consists on transforming the problem data into the elements included in the OEE formula. Then, the OEE rates in both situations (BEFORE and AFTER) can be calculated. Calendar time = 10 days · 24 h = 240 h BEFORE planned stops 0 hours Load time = 240 h Operating time breakdowns = 3+1+2+1+1+2+5 = 15 h setups = 4+4+4= 12 h 6+7+…+3 = 45 defects 88+70+78+…+79 = 773 units (90 u/d theoretical)
IT6. cont Calendar time = 10 days · 24 h = 240 h planned stops 20 hours Load time = 220 h Operating time breakdowns = 1+2+3 = 6 h setups = 4+4+4 = 12 h 5+8+…+7 = 42 defects 77+72+…+75 = 755 units (90 u/d theoretical) • The OEE rate has increased. • Regardless of the increment of the OEE rate, total production has decreased. As a consequence, planned stops must be reanalyzed to reduce the maintenance time. For example, maintenance task can be studied in order to improve the way they are executed.
IT7 First step: consists on transforming the problem data into the elements included in the OEE formula. Then, the OEE rates in both situations (BEFORE and AFTER) can be calculated. Calendar time = 10 days · 24 h = 240 h BEFORE planned stops 0 hours Load time = 240 h Operating time breakdowns = 2+5+3+6 = 16 h setups = 3+3+3 = 9 h 7+6+…+6 =55 defects 70+65+…+67 = 713 units (90 u/d theoretical)
IT7. cont Calendar time = 10 days · 24 h = 240 h planned stops 0 hours Load time = 240 h Operating time breakdowns = 3+4+1+7+1 = 16 h setups = 3+3+3= 9 h 16+14+…+2 = 83 defects 81+70+…+69 = 725 units (90 u/d theoretical) • The OEE rate has decreased. • Quality rate has decreased… It seems to be a non effective solution… According to the theoretical chapter, when applying source inspection and Poke-yoke strategies, the defect rate will increase because many of the process defects that went undiscovered previously are going to be detected.
IT8 The problem is very similar “almost identical” to the Problem nº IT2.The only difference is that there is a rework, which allows recovering some units. We will calculate the three rates included in the Overall Equipment Efficiency rate taking into account the information included in the problem. The first step would be improving Quality rate analyzing the defects source.