Economic Profile: Region 10
570 likes | 758 Vues
Economic Profile: Region 10. Uric Dufrene Sanders Chair in Business IU Southeast. Outline. Demographics Commuting patterns Employment and labor force Compensation Retail sales activity Historical long term growth Recent economic performance. demographics. Region 10. Crawford Clark

Economic Profile: Region 10
E N D
Presentation Transcript
Economic Profile: Region 10 Uric Dufrene Sanders Chair in Business IU Southeast
Outline • Demographics • Commuting patterns • Employment and labor force • Compensation • Retail sales activity • Historical long term growth • Recent economic performance
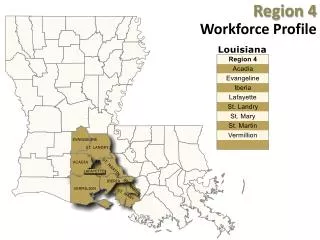
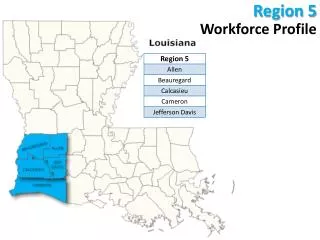
Region 10 • Crawford • Clark • Floyd • Harrison • Scott • Washington
Population Region 10 Source: STATS Indiana
Population by AgeRegion 10 Source: STATS Indiana
Race and EthnicityRegion 10 Source: STATS Indiana
Household TypesRegion 10 Source: STATS Indiana
Income and PovertyRegion 10 Source: STATS Indiana
School EnrollmentsRegion 10 Source: STATS Indiana
IN=19.4% (BS) Source: STATS Indiana
Clark Commuting Source: STATS Indiana
Floyd Commuting Source: STATS Indiana
Washington Commuting Source: STATS Indiana
Harrison Commuting Source: STATS Indiana
Crawford Commuting Source: STATS Indiana
Scott Commuting Source: STATS Indiana
Non Farm PayrollsRecession Start to Now Source: STATS Indiana
Non Farm Payroll LevelsRegion 10 Source: STATS Indiana
Total Compensation Source: STATS Indiana
Total Compensation Per Job Source: STATS Indiana
Change in Compensation Per Job Source: STATS Indiana
Retail Sales, Region 10 Source: STATS Indiana
Retail Sales by County Source: STATS Indiana
Shift Share Analysis • Allows us to determine county performance of specific sectors, relative to the nation and industry. • Does the area enjoy any local competitive advantage?
Did not keep pace by county1999 to 2009 Georgiastats.uga.edu
Payrolls: National and L’ville (blue)Year over year Percent Change