Download
1 / 6
60 likes | 184 Vues
This document explores various statistical analyses, including mean, median, mode, and range for different datasets. It involves Jim's bowling scores to evaluate his performance, as well as James's monthly savings contributions to identify trends and outliers. Additionally, we analyze a group's student heights through histograms, addressing questions about class size and specific height counts. Understanding these statistical measures can provide insights into individual performances and group characteristics.

E N D
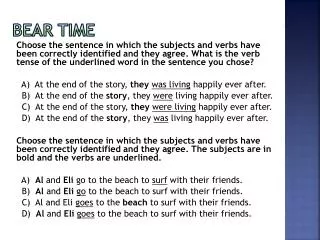
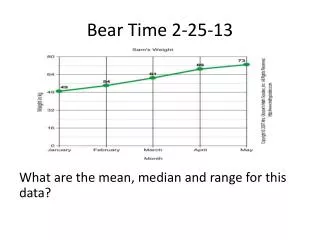
Bear Time 2-25-13 What are the mean, median and range for this data?
Bear Time 2-26-13 • Jim bowled 5 games, getting scores of 117, 125, 123, 118 and 197. Find the mean, median and range of the data. • Which measure of central tendency is a better representation of what kind of bowler Jim is, Mean or Median? Why?
2-27-13 • The following list of numbers shows the amount of money James puts in his savings account each month for the last year. 40, 50, 75, 35, 35,45,50, 50, 35, 45, 50, 50 • What is the median, mode, range and are their any outliers?
Bear Time 2-28-13 The accompanying histogram shows the heights of the students in Kyra's health class. What is the total number of students in the class? How many students are equal to or more than 180cm tall? How many students are less then 170 cm tall? How many students are 189cm tall?
Average Number of Emails sent today Median: ______ Mode: ______ Range: ______
Data for stem and Leaf plot • 95, 89, 79, 55, 90, 88, 77, 84, 75, 82, 83,