Download
1 / 33
330 likes | 348 Vues
Join our online astronomy course in Spring 2012 to learn about stars, constellations, and galaxy observations. Discover the wonders of the night sky with expert instructors. Enhance your understanding of celestial objects through interactive sessions.

E N D
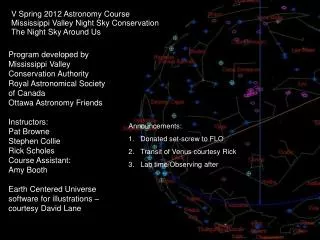
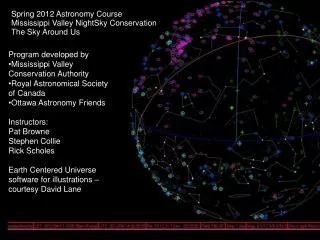
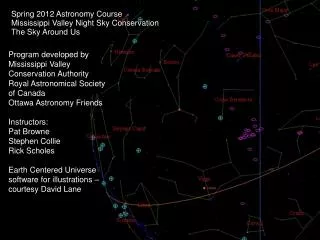
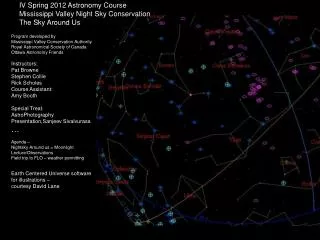
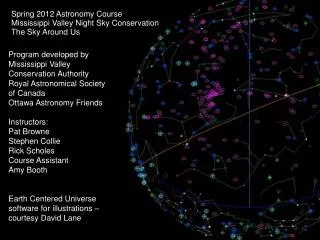
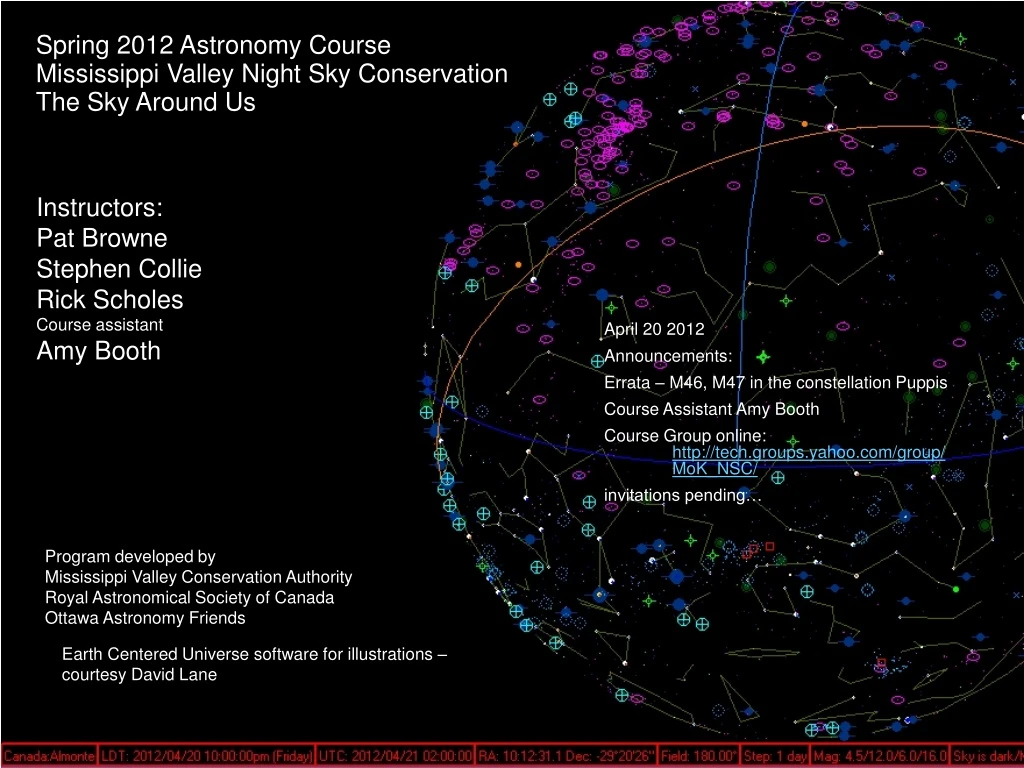
Spring 2012 Astronomy CourseMississippi Valley Night Sky ConservationThe Sky Around Us Instructors: Pat Browne Stephen Collie Rick Scholes Course assistant Amy Booth April 20 2012 Announcements: Errata – M46, M47 in the constellation Puppis Course Assistant Amy Booth Course Group online: http://tech.groups.yahoo.com/group/MoK_NSC/ invitations pending… Program developed by Mississippi Valley Conservation Authority Royal Astronomical Society of Canada Ottawa Astronomy Friends Earth Centered Universe software for illustrations – courtesy David Lane
II Stars in our Milky Way Galaxy WHERE Locating stars on the Celestial Sphere -Constellations, Aligning our telescopes to track the stars WHEN Do they rise and set on our local horizon WHAT Stellar properties, stellar designation, classification asterisms clusters of stars WHO Pioneers in stellar astronomy: Annie Jump Canon Helen Sawyer Hogg (Canadian) Ejnar Hertzprung- Henry Russell
Last week on our plansiphere Our first NightSky…
Objects on our Celestial Sphere = Stars in our Milky Way Galaxy Celestial Sphere – April 20 2012 Recall: What we see in the sky depends • Date • Time • What our latitude is which sets our local horizon • Demo first on the planisphere then on the celestial sphere (local horizon) • Lets do this for April 20… The stars rise 4 minutes earlier each day because the earth has also moved through its orbit as it has rotated around from night to day to night.
Star Time – Sidereal Time A year on earth in star time… 1 Day = 1/365th of a circle ~ about one degree around the Sun. Earth rotates on its axis as well as rotates around the sun. So, the time for a star to return to the same place in our sky the following evening is only 23 hours, 56 minutes and 4 seconds (not 24) This is called a sidereal day ( 1 revolution of the earth with respect to the stars) Do the earth rotating dance around the sun then with respect to the stars infinitely far away… Sidereal Time = our time measurement with respect to the stars..
Say ‘goodbye” to winter constellations Lets do this for Apr 20…
Observations from Last week Open ClustersNebula and Stars Globular ClustersGalaxies
Mars As the Earth Turns –Tour of the Night SkyApril 13 2012, 9pm EDT N/S line - Meridian M44 M67 When planning your are observing session , start with the things that are going to set first – Westward HO! Here is the ECU view of the celestial sphere showing the western sky, You can see this on your planisphere. But your planisphere does not record the planets because they change from year to year. ECU can program the planets in… Jupiter, nearly set… Venus (the brightest object) We shall see a phase on Venus Constellation Object ---------------- --------- Taurus M1 Crab Nebula – Supernova remnant Taurus M45 – the Pleaides – setting… Gemini M35 – Open Cluster Auriga M37,M36,M38 OCs Orion M42 Orion Nebula Emission, M78 Reflection Nebula Monoceros M46, M47 OCs Cancer M44 Beehive Cluster , M67 We finish the Western tour with ruddy Mars which is culminating on our meridian. M37 M35 M36 M46,M47 M38 M1 M78 Venus Venus M42 M45 line of the planets (ecliptic) horizon (west) Jupiter
What We Observed Recall: We went after the western Winter sky – objects that would soon set. These objects were mostly in the Winter Milky Way althouch you couldn’t tell that because the sun was still lighting up the horizon We saw lots of Open Clusters . Their sizes/brightness differences were obvious in Puppis (not Monoceros) M47 vs M46 Cancer Beehive M44 vs M67 We saw Emission and Reflection Nebula like M42 and M43 which are in fact illuminating proto-stars We saw a Supernova Remnant, the Crab Nebula in Taurus, … the Cosmic Dust Bunny! Particular observations?
Distance Graph and Brightness Graphs of what we saw Galaxies Globulars Distancedimming Log When we look at Open Clusters, we are looking into the disk of the Milky Way between 500 – 1000 light years distance. It turns out we are looking at two different spiral arms – Auriga Open Clusters are in the Perseus Arm, whereas the Orion/Puppis clusters are in the Orion Arm When we look at Globular Clusters we are looking 10x more deeply out of the disk of the galaxy in a halo around it – M3 is one example Finally when we look at Galaxies, we are looking outside of our own galaxy > 10,000,000 light years The brightest objects are the smaller magnitudes! ! Surface brightness depends on the concentration of the material as well as the distance to the object. M1, the Crab nebula is considered a difficult object in the city because of its low surface brightness. It is also on the higher end of the distance for these asterisms.
Practical Procedures – when thinking about Telescopes What we practically need to know is how to set up our scopes if we have an equatorial mount. … Setting up our equatorial mount is just like setting our local horizon on the celestial sphere…
To set the scope polar axis to the celestial polar axis, the wedge is rotated to match the altitude of polaris at your latitude.This is the same thing as setting the altitude of the polestar equal to our latitude (45 deg) Point the telescope North and Look up the polar axis. Se the altitude of the wedge to • your Latitude. To line us up on the axis. We do this by • pointing to the Pole star Polaris. Polaris should be centered in the eyepiece www.astro-baby.com/simplepolar/simple_polar_alignment.htm
Celestial Coordinate System = Equatorial Mount Coordinates Once we are aligned, we only have to nudge the Right Ascension axis (around the polar axis), in order to keep the object centered in the eyepiece. Because when we are aligned with our polar axis we track the sky. Polaris in not on the zenith but roughly 45 degrees up = our latitude above the equator Meridian facing north Lines of Right Ascension Parallels of Declination Celestial Equator The equatorial mount has the same axes as the celestial sphere. It is an alt-azimuth mount that has been tilted up to the pole star so that one axis can be turned with the earth turning.
Back to what’s out there in …the Night Sky … Different scopes without equatorial mounts Star hopping to find objects does not require fancy mounts
When we observe… • Always dress warmly as if it were still winter. • Standing around in the springtime can get chilly because you are not moving • Allow your eyes to adapt to what you are seeing • Learn not to stare into the eyepiece but let your eye relax and allow the peripheral vision to see things too • Use a red flashlight to consult charts if you are trying to hunt something down • Keep an observing Log! and record observations even if you’re tired • “If you don’t keep a logbook you’ll always be a beginner.”
Celestial Sphere Earth Centered Universe Computed for our location M65, M65 Galaxies Given our geographical position and time on the earth: our latitude, our time zone and our Time of Day, ECU displays an accurate description of our celestial sphere for our position on the earth. We can use a manual planisphere, set it for our time of year and day for our location to determine whether the object is above our horizon, what our L.S.T is, to place it on our meridian, etc We are ready to plan our observing session and view not only stars, but star clusters, galaxies,etc. But everything, stars, asterisms, constellations, galaxies have a time and a season… according to sidereal time.
Constellations: Area of sky identifiable by star pattern Ursa Major Constellations and asterisms are not necessarily close to each other in space. Everything is at a nearly ‘infinite’ distance on our celestial sphere within our Milky Way. This is to assign proper oordinates to them. Historically, the brightest stars on were grouped together into constellations and asterisms and the brightest stars gained proper names. Extensive catalogues of stars have been assembled by astronomers, which provide standardized star designations. Greek Letters (Bayer Catalogue) order by relative brightness so that Alpha Leonis is brighter than Gamma. Their absolute positions in RA and DEC were recorded at special Meridional telescopes fixed to watch stars culminating on the meridian. The ancients grouped those constellations that traveled along the ecliptic (the path of the planets) into the Zodiac There are 4 zodiacal constellations here… Gemini, Cancer, Leo, Virgo 12 Zodiacal Constellations out of 88 modern ones (including Southern Hemisphere). Looking South then pan east or west of our meridian Click to see the major constellations Bootes Gemini Leo Cancer ecliptic Mars Virgo Saturn Corvus Hydra Exercise 1: Go out and observe these constellations. How many bright stars can you see in them. Number them… Optional – DVD Chapters 4,5,6,7,8,9,11,12
What visual clues tell us? Brightness Colour Brightness doesn’t really tell us the distance (parsecs or light years) because we need to know their intrinsic brightness Colour – will tell us something about their temperature Other Properties luminosity (intrinsic brightness) and spectra (relative abundance of spectral lines in the light from the star), Tell us about -the age (> millions of years) - the distance to the object -chemical composition of the stellar object. When we observe stars naked eye …Starlight and Spectra (some clues) Without its spectral type a star is a meaningless dot. Add a few letters and numbers like "G2V“ and the star suddenly gains personality and character
WHAT is a star… The Sun is a Star Sun is below our horizon at 10 pm along the path of the plane of the ecliptic A star is a massive, luminous sphere of plasma held together by gravity At the end of its lifetime, a star can also contain a proportion of degenerate matter. The nearest star to Earth is the Sun, which is the source of most of the energy on Earth. In a plasma gas, a certain portion of the particles are ionized. This is because the gas is heated to high temperatures at which point a gas may ionize its molecules or atoms (reduce or increase the number of electrons in them), thus turning it into a plasma, which contains charged particles: positive ions and negative electrons or ions. This figure shows some of the more complex phenomena of a plasma. The colors are a result of relaxation of electrons in excited states to lower energy states after they have recombined with ions. These processes emit light in a spectrum characteristic of the gas being excited.
Visual Star Colour and Star Spectra using Spectroscope When a star is brought into the field of view and the spectroscope is properly focused and adjusted, you will see a beautiful spectrum with the colors of the rainbow spread out along its length. Depending on the spectral type and luminosity class of the star, and your particular setup, you may see hydrogen lines cutting perpendicular across the spectrum, or many fine lines of metals, or wide absorption bands of molecules. These lines and bands in stellar spectra have been called the "fingerprints of the stars" because their patterns identify the elements in a star's atmosphere and indicate a star's temperature. These spectral features are easy to see in some classes of stars and more difficult to see in others. The image below was taken with the Visual / Photo / CCD Star Spectroscope: http://www.starspectroscope.com/index.html How are spectral lines formed? By electrons jumping between different energy levels in the atoms in the star's outer layers. Bound electrons can absorb and emit energy only in certain discrete amounts. When an electron absorbs a photon of light with just the right amount of energy, it jumps to a higher energy level. When the electron spontaneously jumps back to a lower energy level, a photon is emitted. Enough electrons jumping between any two given energy levels of a given element will result in a spectral emission or absorption line at a characteristic wavelength. For example, the strongest spectral line in a hot main-sequence star like Vega lies in the blue-green part of the spectrum. It is a dark or absorption line resulting from electron jumps from the second to the fourth energy level of the neutral hydrogen atom, and is known as hydrogen beta (in the Balmer series).
Color Star Atlas or Color Stars in ECU The main reason why stars are differently coloured is that some are hotter than others. Deep in their interior all stars are enormously hot (measured in millions of degrees), but their temperature lessens towards their outer layers, and the coolest star pours out most of their visible radiation in the red part of the spectrum. Hotter stars like the Sun appear yellow, still hotter stars appear white, and the hottest appear blue. The spectral type of a star is not the same thing as its intrinsic colour although the two are closely related. When starlight passes through a spectograph ( a prism or glass grating) it is split into the colors of the rainbow, a spectrum. Most importantly there are spectral absorption lines that give a clue to the temperature and the chemical composition of that star Almost all starlight spectra can be assigned to one of seven main types (OBAFGKM). A great deal about the nature of the star can be inferred from its spectrum : how bright it really is, how massive it is, whether it is a compact main sequence star (see next slide) or a swollen giant. Broadly speaking, we can tell how old it is, and what is happening to it with respect to its hydrogen, helium or heavier element combustion process. Coma Star Cloud – and star colours!
Hertsprung-Russell Diagram to classify Stars according to their Spectral Class Stars and their Spectra Most stars gather in certain narrow regions of the H-R diagram according to their masses and ages. Stars arrive on what's called the main sequencesoon after they are born, and this evolutionary track is where they spend most of their lives. Massive stars blaze brightly on the hot, blue end of the main sequence. They burn up their nuclear fuel in only millions or tens of millions of years. Stars with lower masses comprise the yellow, orange, and red dwarfs on the lower-right part of the main sequence, where they remain for billions of years. As a star begins to exhaust the hydrogen fuel in its core, it evolves away from the main sequence toward the upper right and becomes a red giant or supergiant. Stars that began with more than eight times the Sun's mass then evolve left and right through complicated loops on the H-R diagram as if in a frenzy to keep up their energy production. Then they finally explode assupernovae. Less massive giants evolve to the left and then down to becomewhite dwarfs; this is the track the Sun will trace through the H-R diagram
Stellar classification is a classification of stars based on their spectral characteristics. The spectral classof a star is a designated class of a star describing the ionization of its chromosphere, what atomic excitations are most prominent in the light, giving an objective measure of the temperature in this chromosphere. Light from the star is analyzed by splitting it up by a diffraction grating, subdividing the incoming photons into a spectrum exhibiting a rainbow of colors interspersed by absorption lines, each line indicating a certain ion of a certain chemical element. The presence of a certain chemical element in such an absorption spectrum primarily indicates that the temperature conditions are suitable for a certain excitation of this element. If the star temperature has been determined by a majority of absorption lines, unusual absences or strengths of lines for a certain element may indicate an unusual chemical composition of the chromosphere. Most stars are currently classified using the letters O, B, A, F, G, K, and M (usually memorized by astrophysicists as "Oh, be a fine girl, kiss me"), where O stars are the hottest and the letter sequence indicates successively cooler stars up to the coolest M class. According to informal tradition, O stars are called "blue", B "blue-white", A stars "white", F stars "yellow-white", G stars "yellow", K stars "orange", and M stars "red", even though the actual star colors perceived by an observer may deviate from these colors depending on visual conditions and individual stars observed http://en.wikipedia.org/wiki/Stellar_classification
Whether in a star's atmosphere or in a laboratory, absorption lines are produced when a continuous rainbow of light from a hot, dense object (top left) passes through a cooler, more rarefied gas (top center). Emission lines, by contrast, come from an energized, rarefied gas such as in a neon light or a glowing nebula. Stellar Spectratells us surface temperature,chemical compositionatmospheric pressure and surface gravity,total luminousity (energy pouring out) http://www.skyandtelescope.com/howto/basics/3305876.html?page=2&c=y When I look at a star, why do I see dark absorption lines rather than bright emission lines? Gas under high pressure produces a continuous spectrum, a rainbow of colors. Continuous radiation viewed through a low density gas results in an absorption-line spectrum. What's happening here is that radiation emitted by gas under high pressure deep within the star is being absorbed by low density gas in the star's outer layers. We can show this in the lab: Using a slit and prism, physicists discovered that when a solid, liquid, or dense gas is heated to glow, it emits a smooth spectrum of light with no lines: a continuum. A rarefied hot gas, on the other hand, glows only in certain colors, or wavelengths: bright, narrow emission lines instead of a rainbow band. If a cooler sample of the same gas is placed in front of a glowing object emitting a continuum, dark absorption lines appear at the wavelengths where the emission lines would be if the gas were hot. What kinds of deep sky objects have emission-line spectra? A low density gas shows an emission-line spectrum, when not observed against a background of continuous radiation. Thus emission lines are found in the spectra of planetary and diffuse nebulae, and in some stars. In the latter case the lines often arise from gas clouds ejected from the star by strong stellar winds.
Annie Cannon 1863 –1941 Harvard College Observatory Astronomer applied her own scheme which resulted in the famous OBAFGKM classification which is still used today The Sun's spectrum was marked by many narrow, black lines of various intensities. These dark lines stayed at exactly the same places in the colorful band from day to day and year to year. This solar spectrum — a 'rainbow' of sunlight with thin, dark absorption lines at numerous discrete wavelengths. Each chemical element creates its own unique set of spectral lines. Similar spectral lines showed up in laboratory The sun is a G2 star representing 7.2% of the statistical population within 10 pcs.
Stellar Spectra Summary • Stellar Spectra • surface temperature • chemical composition • atmospheric pressure and surface gravity • total luminousity (energy pouring out) • *The temperature sets the star's color and determines its surface brightness: • how much light comes from each square meter of its surface. • The atmospheric pressure depends on the star's surface gravity and therefore, roughly, on its size — • telling whether it is a giant, dwarf, or something in between. • The size and surface brightness in turn yield the star's luminosity (its total light output, or absolute magnitude • and often its evolutionary status (young, middle-aged, or nearing death).) • The luminosity (when compared to the star's apparent brightness in our sky) • also gives a good idea of the star's distance T=5500 • Note also that the colour of the star is related to the • corresponding peak wavelength emitted • of the continuous radiation: • λmax = b/ T • where λmax is the peak wavelength, T is the absolute temperature • of the black body, and b is a constant of proportionality • called Wien's displacement constant, value). • http://en.wikipedia.org/wiki/Wien's_displacement_law • Knowing the suns temperature, we infer a particular • colour expressed as a wavelength in the visible … T = 5000 λ = λmax
Stellar Classification - Who • http://astro.berkeley.edu/~gmarcy/women/cannon.html Annie J. Cannon discovered that nearly all stars' spectra can be fit into one smooth, continuous sequence. The sequence matched the stars' color temperatures, from the hottest, blue-white stars at one end to relatively cool, orange-red ones at the cool end . The basic sequence ran O B A F G K M from hot to cool.
Planning yourObservations • Get a book from the library ora magazine that features a particular selection of objects visible from your location at the current date • You can use ipod type devices but plan what you are doing beforehand so that you don’t just stare at the ipod • Better to plan indoors first . Use a planetarium program like ECU. We can do a lab showing how to set the time, place, information detail, catalogues… • Make sure you are comfortable at the eyepiece • You can sit down when you get tired. Plan your session. Choose an area to work on and pick from a list of different things: stars with colour/ colour contrast star clusters star nebulae and nursuries galaxies supernovae remnants clusters of galaxies ECU Earth Centered Universe
Looking up – Spring Night Sky exploration What binary stars can you see – pick some famous ones What color contrasts can you observe? Blue and yellow?? 1. How do you use stellar ‘landmarks’ to hop to non- stellar objects such as the Virgo Cluster of Galaxies (hint – Find Epsilon Virgo and Beta Leonis) … or the cluster of galaxies in 2. Leo, M65,M66? 3What does the M stand for… when we talk about Messier objects? 4.What kinds of M objects are there? 5.What kind of object is M44? (The Beehive cluster)
Star- Hopping to find Star Clusters and Clusters of Galaxies To find the Markarian Chain of Galaxies in the Virgo cluster, locate Epsilon Virginis and Beta Leo . They lie half-way along the line To find M65, M65 drop down from Theta Leonis To find M3 (Globular Cluster) locate Arcturus (Alpha Bootes) and Alpha Canes Venatici (not shown) . M3 is 1/3 of the way from Alpha Bootes See ObservingGalaxies.ppt on the Millstone Website for more information Alpha Bootes