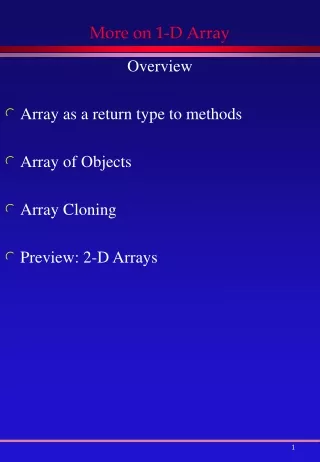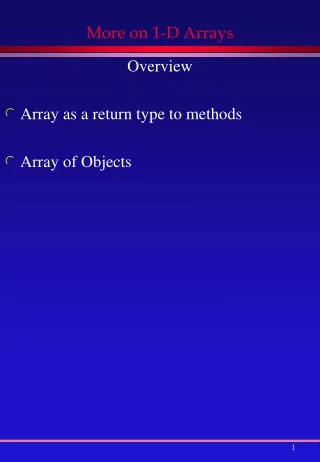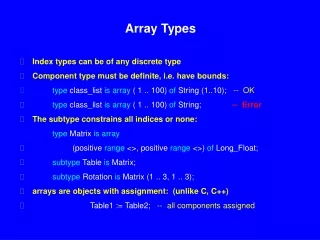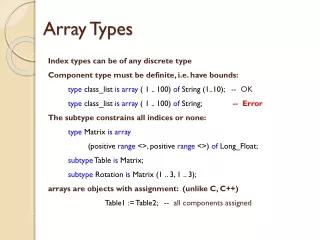
Electrode Spread (Array type)
C 1. P 1. P 2. C 2. Surface. C 1. P 1. P 2. C 2. Surface. Electrode Spread (Array type). 1- Wenner Array. a. a. a. 2- Schlumberger Array. r. r. C 1. C 2. P 2. P 1. na. a. a. Surface. 3- Dipole-Dipole Array. C 1. P 1. P 2. C 2. a. na. 4- Pole-Dipole Array. C 1.


Electrode Spread (Array type)
E N D
Presentation Transcript
C1 P1 P2 C2 Surface C1 P1 P2 C2 Surface Electrode Spread (Array type) 1- Wenner Array a a a 2- Schlumberger Array r r C1 C2 P2 P1 na a a Surface 3- Dipole-Dipole Array C1 P1 P2 C2 a na 4- Pole-Dipole Array C1 P1 P2 C2 a 5- Pole-Pole Array
C1 P1 P2 C2 a 6- Gradient Array Surface P0 C1 P1 P2 C2 ½ a ½ a 7- Lee-partition Array a a Surface P2 C2 a a C1 a P1 a 8- Square Array
Advantages and Disadvantages of Wenner and Schlumberger Arrays The following table lists some of the strengths and weaknesses of Schlumberger and Wenner sounding methods.
Survey Design and Procedure Survey design depends on the specific characteristics of the site and the objective of the survey. The three most common modes of electrical resistivity surveying are profiling, sounding, and profiling-sounding, each having its own specific purpose. If the purpose of the survey is to map the depths and thickness of stratigraphic units, then the electrical resistivity data should be collected in the sounding mode. Lateral electrical resistivity contrasts, such as lithologic contacts, can best be mapped in the profiling mode. In cases where the electrical resistivity is expected to vary both vertically and horizontally, such as in contaminant plume mapping, the preferred mode is profile sounding. 1- Sounding Mode As we've already shown, the resistivity method can detect variations in resistivity that occur solely in depth. In fact, this method is most commonly applied to look for variations in resistivity with depth. Surveys that are designed to determine resistivity variations with depth above some fixed surface location are referred to as resistivity soundings. In these experiments, electrode spacing is varied for each measurement. The center of the electrode array, where the electrical potential is measured, however, remains fixed. An example of a problem for which one might employ resistivity soundings is the determination of the depth to water table The two most common arrays for electrical resistivity surveying in the sounding mode are the Schlumberger and Wenner arrays. Electrode geometry for both arrays is shown in Figure below. Increasing the separation of the outer current electrodes, thereby driving the currents deeper into the subsurface increases the depth of exploration.
Schlumberger Sounding Wenner Sounding VES-1 VES-1 AB/2=1.5, MN/2=0.5 a=1m AB/2=2, MN/2=0.5 a=2m AB/2=3, MN/2=0.5 a=3m AB/2=4, MN/2=0.5 a=4m AB/2=5, MN/2=0.5 a=5m AB/2=5, MN/2=1 Data Table Data Table a,m ρa R AB/2 ρa R 1 1.5 2 2 3 3 4 4 ρa ρa Field Curve Field Curve AB/2 a,m
2- Profiling Mode The two most common arrays for electrical resistivity surveying in the profiling mode are the Wenner and dipole-dipole arrays. The electrode geometry for the Wenner array is the same as the sounding mode — the difference is that in profiling mode the entire array is moved laterally along the profile while maintaining the potential and current electrode separation distances. The electrode geometry for the dipole-dipole array is shown in Figure below. In the profiling mode, the distance between the potential and current dipoles (a dipole consists of a pair of like electrodes) is maintained while the array is moved along the profile. As was mentioned on the previous page, the data collected from resistivity soundings is usually interpretable only for horizontally stratified structures. If you are employing resistivity methods to find vertical structures, one would typically use resistivity profiles instead of resistivity soundings. As described previously, resistivity profiles are resistivity surveys in which the electrode spacing is fixed for all readings. Apparent resistivity is computed for different electrode center points as the electrode spread is moved. Usually the center point is moved along the line of the electrodes, although this does not have to be the case. Shown below is a geological structure involving a vertical boundary between a higher resistivity material to the left and a lower resistivity material to the right. Below the geological model is the apparent resistivity you would observe using a Wenner array as the array is moved from left to right. Note that the distance shown along the bottom of this plot is the distance between the vertical fault and the current electrode farthest to the left of the array.
Profiling by Wenner array a= 5 m 1 2 3 4 5 6 Profile-1 1 2 3 4 5 6 Profile-2 1 2 3 4 5 6 Profile-3 Data Table St. ρa R 1 2 3 4 ρa Field Curve St. (Distance ,m)
3- Profiling-Sounding Mode As in the profiling mode, the Wenner and dipole-dipole arrays are the most common arrays used in the profiling sounding mode. As the name implies, this mode is a combination of the profiling and sounding modes. In the Wenner array the typical field procedure is to collect the data in a succession of profiles, each having a different electrode separation. The resulting data therefore contains information about the lateral and vertical electrical resistivity variations. (1) (3) (2)