Download
1 / 35
350 likes | 493 Vues
Synergies between solar UV radiometry and imaging. Matthieu Kretzschmar ° Jean-François Hochedez ° Véronique Delouille ° Vincent Barra * Thierry Dudok de Witte ‘. ° Royal Observatory of Belgium, Brussels * ISIMA, Clermont-Ferrand, France ‘ LPCE, Orléans, France. A curtain !.

E N D
Synergies between solar UV radiometry and imaging Matthieu Kretzschmar ° Jean-François Hochedez ° Véronique Delouille ° Vincent Barra * Thierry Dudok de Witte ‘ ° Royal Observatory of Belgium, Brussels * ISIMA, Clermont-Ferrand, France ‘ LPCE, Orléans, France J.-F. Hochedez, COSPAR ’06, Beijing
A curtain ! A snake ! A wall ! A metaphor about multi-dimensionality Dr Elephant J.-F. Hochedez, COSPAR ’06, Beijing
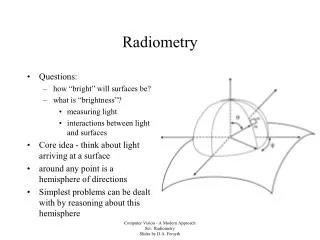
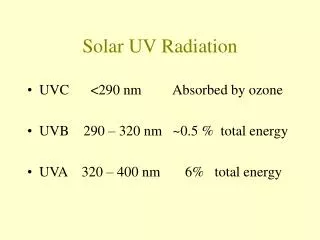
Dimensions of (solar UV) observations Effective area, calibration & signal to noise Cadence Exposure time Field of View Spatial resolution Temporal coverage (Long-term and duty cycle) Spectral range & resolution + polarimetric diagnostics J.-F. Hochedez, COSPAR ’06, Beijing
Radiometer TIMED-SEE, PROBA2-LYRA… No spatial resolution Spectral resolution! Inflight re-calibrated Full Sun More or less spectral resolution Avoid time gaps Good cadence & SNR EUV Imagers SOHO-EIT, PROBA2-SWAP… Imaging Optical design or rastering Flatfield issues Partial FOV Multilayer passbands Usually not 100% duty cycle Possible polarimetry Photon limited Imagers vs. spectro-radiometers J.-F. Hochedez, COSPAR ’06, Beijing
Launch end 2007 (2-year mission) • 60 cm x 70 cm x 85 cm, 120 kg • LEO dawn-dusk orbit • Demonstrate new space technologies SWAP & LYRA « the High-cadence solar mission » J.-F. Hochedez, COSPAR ’06, Beijing Image courtesy: Verhaert
The solar payload of PROBA2 • LYRA • VUV, EUV & XUV radiometer • PI: JF Hochedez • LYRA.oma.be • SWAP • EUV imager • PIs: D Berghmans JM Defise • SWAP.oma.be Sun J.-F. Hochedez, COSPAR ’06, Beijing
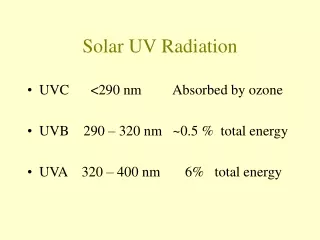
LYRA highlights • 4 channels covering a wide temperature range • 200-220 nm Herzberg continuum range • Lyman-alpha (121.6 nm) • Aluminium filter channel (17-70 nm) incl. He II at 30.4 nm • Zirconium filter XUV channel (1-20 nm) (rejects strongly He II) • Traceable to radiometric standards • Calibration campaigns at PTB Bessy synchrotron • In-flight stability • Rad-hard, not-cooled, oxide-less diamond UV sensors • 2 different LEDs per detector • Redundancy (3 units) • High cadence (up to 100Hz) • Quasi-continuous acquisition during mission lifetime J.-F. Hochedez, COSPAR ’06, Beijing
Dec 2005 tbc J.-F. Hochedez, COSPAR ’06, Beijing April 2006 tbc
One of the 3 LYRA units J.-F. Hochedez, COSPAR ’06, Beijing
SWAP highlights • 1 channel at 17.4 nm, 1kx1k CMOS-APS detector • Detector and global instrument calibrated at PTB • Good cadence • 1 min consistent with spatial resolution • Quasi-continuous acquisition during mission lifetime • Duty cycle limited by telemetry only J.-F. Hochedez, COSPAR ’06, Beijing
PROBA2SWAP J.-F. Hochedez, COSPAR ’06, Beijing
SWAP TARGETS Dimmings EIT wave Post-eruption arcade Loop openings Plasmoid lifting Flares Erupting prominences J.-F. Hochedez, COSPAR ’06, Beijing
How can SWAP and LYRA work together? SWAP 3,11’’ 1 mn ~10s 17.5 nm 1nm FWHM LYRA None ~50 ms 10 ms [0,20]nm [17,70]nm 121.6 nm [200-220]nm Spatial resolution: Temporal resolution: - Nominal: - Optimal/max: … x 1200 Time 0 mn 1 mn Spectral resolution: Wavelength
Spectral information 1 20 121 220 200 • Can we use the fact that the spectral overlap between the Al & Zr LYRA channels corresponds roughly to the SWAP pass band ? • No TBC • Can we use the 4 (wide ) LYRA pass bands to model 17.5nm? • DEM-like, statistical and/or empirical methods • 2 pass bands are optically thick Wavelength (nm) 17 70
Zirconium Aluminium SWAP 104 105 106 107 108 Plasma temperatures seen by SWAP and LYRA • Corona (cold 1MK, and ‘hot’ 10MK) • Transition region + Corona. • Corona mainly cold • LYRA & SWAP spectral coverage are very different useful to think in term of T° • Contribution functions (assuming thermal equilibrium) J.-F. Hochedez, COSPAR ’06, Beijing
Preliminary conclusions oncombining spectral information • Hard to “spectrally” combine LYRA and SWAP • But, LYRA Al and Zr include SWAP • LYRA-Zr and SWAP observe ~same plasma J.-F. Hochedez, COSPAR ’06, Beijing
EUV irradiance model track AR, QS, CH Cf. NRLEUV (Warren et al 2001), Kretzschmar et al 2004 If success, whole spectral irradiance variability is modeled hence LYRA time series (at SWAP cadence only) Mid-term variation Using SWAP to identify the regions that make the irradiance vary J.-F. Hochedez, COSPAR ’06, Beijing
A prospectful new field 4 LYRA pass bands chronologyof solar events in different parts of the solar atmosphere Can we observe irradiance counterparts brightenings, dimmings, others? Small-term variations Using SWAP to identify the regions that make the LYRA irradiances vary SEM:0-50 nm J.-F. Hochedez, COSPAR ’06, Beijing
If roughly the same plasma, one expects similar normalized variations for integrated count rates Cross-calibrations mutually improve long-term stability Temporal evolution (1/3)Using radiometers to re-calibrate imagers J.-F. Hochedez, COSPAR ’06, Beijing
Temporal evolution (2/3)Contribution of solar regions to irradiance variations SEM [0.5-50nm] EIT 19.5 nm (integrated) Comparing instruments with different aim(s) and pass bands… e.g. SEM Flares not visible in the integrated EIT flux at 19.5
Temporal evolution (2/3)Contribution of solar regions to irradiance variations • Method: • Segment regions by hand on 1st image • Rotate images so that regions of interest appear always at the same position. • Not the best method but fast and quite easy • The rotation induces some unwanted effects • Results are indicative & illustrative Data: 1st of April 1997; Several flares and EIT waves EIT image at 19.5 nm every 12 min Irradiance data from SEM 0.1-50 nm and 26-34nm, cadence 5 min
last Last image First image Last, and rotated SEM [0.5-50nm] EIT 19.5 nm (integrated) Last image (rotated)
last First image ACTIVE REGION 1 (AR1) Last, and rotated SEM [0.5-50nm] EIT 19.5 nm (integrated) Last image (rotated)
last First image ACTIVE REGION 2 (AR2) Last, and rotated SEM [0.5-50nm] EIT 19.5 nm (integrated) Last image (rotated)
last First image QUIET SUN 1 (QS1) Last, and rotated SEM [0.5-50nm] EIT 19.5 nm (integrated) Last image (rotated)
last First image QUIET SUN 2 (QS2) Last, and rotated SEM [0.5-50nm] EIT 19.5 nm (integrated) Last image (rotated)
SEM 0.1-50 nm SEM 30.4 nm AR1 • Most of the activity associated to AR1 • AR2 anti-correlated? • Some SEM flares not seen in EIT • Finer details! AR2 QS1 QS2 (around AR) Instrumental pb
SEM 0.1-50 nm SEM 30.4 nm AR1 AR2 QS1 QS2 (around AR) EIT difference images
SEM 0.1-50 nm SEM 30.4 nm Flare AR 1 AR 2 Bright front of EIT wave QS 1 QS2 .. And dimming
Temporal evolution (3/3) • Imagers can potentially compute irradiance for other heliospheric directions • i.e. other planets • c.f. Auchère et al 2005 • Use hi-cadence radiometer time series to decrease temporal aliasing in image sequences… • Having assessed expected variability = f(x,y) J.-F. Hochedez, COSPAR ’06, Beijing
PROBA2 has eclipse periods. During occultation, it will see the Sun thru the Earth’s atmosphere This allows LYRA to measure the attenuation of the solar flux from which one can derive atmospheric properties Using LYRA for aeronomy studies Apparent Sun diameter: 25 km LYRA measurements J.-F. Hochedez, COSPAR ’06, Beijing
Independent SWAP occultation observations Cadence limited Only 17.4nm Imaging sequence No need to deconvolve for Sun area No need to assume disc homogeneity Using SWAP for aeronomy studies SWAP measurements J.-F. Hochedez, COSPAR ’06, Beijing
Conclusion • Design new full Sun instruments meant to optimize the spectro-spatio-temporal balance! • Spectro-heliograph (such as on CORONAS-F)? • Array of >9 “low” spatial resolution multilayer telescopes paving the accessible UV spectrum • Smart camera schemes autonomously compromising between cadence and SNR J.-F. Hochedez, COSPAR ’06, Beijing
Quit complaining about your job! J.-F. Hochedez, COSPAR ’06, Beijing