Maximizing Profit in Intra-Firm Exports from US to Finland
Discover pricing strategies for exports from Charlotte, US, to Tampere, Finland, to optimize total net profit through exchange rate considerations. Explore hedging techniques and their impact on profits. Learn about the rise and impact of Sovereign Wealth Funds in international finance.

Maximizing Profit in Intra-Firm Exports from US to Finland
E N D
Presentation Transcript
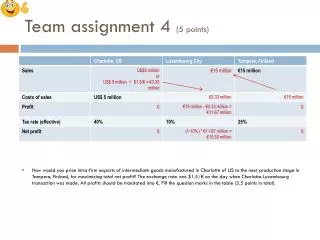
Team assignment 4 (5 points) • How would you price intra-firm exports of intermediate goods manufactured in Charlotte of US to the next production stage in Tampere, Finland, for maximizing total net profit? The exchange rate was $1.5/€ on the day when Charlotte-Luxembourg transaction was made. All profits should be translated into €. Fill the question marks in the table (3.5 points in total).
Team assignment 4 (5 points) • Assuming no hedging techniques had been used, what would be the total net profit if the exchange rate on the day of Charlotte-Luxembourg transaction was $1.25/€? All profits should be translated into € (0.5 point).
Team assignment 4 (5 points) • In an effort to hedge foreign currency risk, you had previously bought a forward call option of $1.3/€ at an ignorable cost. The option can be exercised on the day of Charlotte-Luxembourg transaction, when the spot rate was $1.5/€. What would be the total net profit (0.5 point)? What would be the total net profit if the spot rate was $1.25/€ (0.5 point)? All profits should be translated into €. • First, calculate the potential net profit under the call option rate if the option was exercised. • When the spot rate was $1.5/€, the two alternative profit would be: • 1) exercise the option and use the call option rate of $1.3/€, the total profit would be €10.04 million; • 2) do not exercise the option and follow the spot rate of $1.5/€, the total profit (as calculated in question 1) would be €10.50 million. • In order to make a higher profit, we should choose not to exercise the option. • When the spot rate was $1.25/€, the two alternative profit would be: • 1) exercise the option and use the call option rate of $1.3/€, the total profit would be €10.04 million; • 2) do not exercise the option and follow the spot rate of $1.25/€, the total profit (as calculated in question 1) would be €9.9 million. • In order to make a higher profit, we should choose to exercise the option.
Emerging phenomenon in international finance:The rise of sovereign wealth funds (SWFs) Sources: Mark Gordon and Sabastian V. Niles, 2012, “Sovereign wealth funds: An overview”, in Karl P. Sauvant, Lisa E. Sachs, Wouter P.F. Schmit Jongbloed (eds.), Sovereign investment: Concerns and policy reactions, pp. 24-56. Oxford, UK: Oxford University Press. Shai Bernstein, Josh Lerner and Antoinette Schoar, 2013, “The investment strategies of sovereign wealth funds”, Journal of Economic Perspectives, 27(2), pp. 219-237. William L. Megginson, Miao You and Liyan Han, 2013. “Determinants of sovereign wealth fund cross-border investments”, Financial Review, 48(4), pp. 439-572.
SWFs (cont’d) • SWFs are investment vehicles established by governments to invest a portion of their excess foreign exchange reserves in search of higher returns than are typically earned on official reserves. • They are generally invested in safe, low-return instruments such as U.S. Treasury bonds, • The primary economic purposes of these funds include: diversification of national wealth, revenue stabilization, sharing of national wealth across generations, and achieving equity-like investment returns.
SWFs (cont’d) billion Hedge funds: $2.1 trillion
SWFs (cont’d) • Skyrocketing: • They increased ten-fold in the last two decades from $500 billion in 1990 to more than $6 trillion today (largely due to rising price of petroleum and appreciation of local currency such as Chinese RMB). • Unclear and myriad corporate objectives: • First, as a source of capital for future generations • Second, as a stabilizer by reducing the volatility of government revenues • Finally, as holding companies, in which the government places its strategic investments
SWFs (cont’d) Largest exporter 12th largest exporter
SWFs (cont’d) • SWFs played an important role by providing emergency liquidity to major U.S. and European financial institutions at the outset of the recent financial crisis. • Selected Infusions of SWFs into the U.S. financial institutions during the global financial crisis 2007-09 • For political concerns, SWFs typically did not receive special governance rights (e.g., board membership) although their ownership might be greater than many other owners.
SWFs (cont’d) • Their cross-border investment strategies • Megginson et al (2013) studied a sample 1,590 investments in 78 target countries by 15 major SWFs during 1985-2011 and found that SWFs are purely, or primarily, commercially driven. • More transactions came from SWFs from strong economic performance, high degrees of openness to trade, and less developed local capital markets • SWFs are more likely to invest in countries with high levels of investor protection, strong economic performance, and well developed local capital markets • SWFs are more likely to invest in countries sharing the same culture and engaging in bilateral trade • All these findings are similar to other private foreign institutions
Course structure Classes 1-4 Classes 5-9 Class 10 Classes 11-14 International business environment Regional vs. global Triad and IB activities Politics, culture, trade and finance Firm-specific advantages and firm management Organization Production Marketing International HRM Political risk management International financial management Country-specific advantages Locational choice and regional management European Union, North America, Japan, and Emerging Markets
Chance Factor Conditions Demand Conditions Structure of firms and rivalry CSAs in certain industries/products The diamond model: Porter’s explanation of determinants of national competitiveness From Mike Porter’s The competitive advantage of nations.
Human resources • Quality, skills, and cost • Physical resources • Land, water, mineral deposits, timber, hydro power sources, and fishing grounds • Knowledge resources • Scientific, technical, and market knowledge • Capital resources • Amount, type, and cost of financial resources • Infrastructures • Transportation, communications, health-care, etc. Chance Factor Conditions Demand Conditions Structure of firms and rivalry The diamond model: Porter’s explanation of determinants of national competitiveness
Chance • Composition of the home demand • Various niches, buyer sophistication • The size and growth of the home demand • Internationalization of domestic demand Factor Conditions Demand Conditions Structure of firms and rivalry The diamond model: Porter’s explanation of determinants of national competitiveness
Chance • Competitive downstream industries through efficient, early, or rapid access to cost-effective inputs; • Competitive related industries that can coordinate and share activities in the value chain • Competing products/services • Complementary products/services Factor Conditions Demand Conditions Structure of firms and rivalry The diamond model: Porter’s explanation of determinants of national competitiveness
The ways in which firms are managed and choose to compete • The motivations of companies and their employees and managers • The competition intensity in the respective industry Chance Factor Conditions Demand Conditions Structure of firms and rivalry The diamond model: Porter’s explanation of determinants of national competitiveness
Chance • Chance events are occurrences that are outside of control of a firm • New inventions • Political decisions by foreign governments • Wars • Significant shifts in world financial markets or exchange rates • Discontinuities in input costs such as oil shocks • Surges in world or regional demand • Major technological breakthroughs Factor Conditions Demand Conditions Structure of firms and rivalry The diamond model: Porter’s explanation of determinants of national competitiveness
Government influences • Subsidies • Education policies • The regulation or deregulation of capital markets • The establishment of local product standards and regulations • The procurement of goods and services • Tax laws • Antitrust regulation Chance Factor Conditions Demand Conditions Structure of firms and rivalry The diamond model: Porter’s explanation of determinants of national competitiveness
Clustering: Interconnection and Concentration of All These Factors Chance Factor Conditions Demand Conditions Structure of firms and rivalry CSAs in certain industries/products CSAs: Cluster-specific advantages
An example: CSAs for American ICT multinationals such as Google.
Silicon Valley • Chance events: • PC revolution • WWW revolution Supporting industries and institutions: • HR intermediaries: e.g., Smart Valley Inc. • High-standard universities: e.g., Stanford • Information sharing networks: e.g., Enterprise Network; Software Industry Coalition. • Collective lobbyists for deregulation and low tax: e.g., Regulatory Forum; Council on Tax and Fiscal Policy Chance Demand conditions: • Relatively richer consumers • Sophisticated buyers located in the founding district of ICT industries Factor conditions: • Plenty of high-quality computer sciences and engineering graduates • Abundant VC capital network Factor Conditions Demand Conditions Structure of firms and rivalry: • Information sharing across IT researchers is common • Risk-taking and entrepreneurship is a local culture embedded in the wild west California style Government: • Public R&D funding: e.g., SBIR, DARPA, etc. • Public VCs: e.g., CalPERS • Tax exempt for selected VC activities. Structure of firms and rivalry CSA for ICT industries/products An example: CSAs for American ICT multinationals such as Google.
Limitations of the Diamond Model The rise of the Great Lakes area as a cluster of auto industry
Up to 58 hours closer Asia’s pacific ports 5 days LA-Long Beach An example: North Am auto industry Canadian railways and ports of entry/exist serving the US markets
GDP US$1.7 trillion GDP US$15 trillion 3 billion bbl per year just for running vehicles, not including production etc. An example: North Am auto industry (cont’d): Oil reserves in Canada; Oil pipelines between Canada and US; Auto industry in the US.
FTA since Jan 1988 NAFTA since Jan 1994 An example: North Am auto industry (cont’d) Free-trade agreement
The double diamond: Regional integration of multiple countries Prince Rupert and Vancouver in British Columbia as ports of entry CN and CP railways as inter-state transportation Chance events e.g., a decent market with high purchasing power e.g., oil reserves Pacific gateway initiative (NA)FTA since 1988 Keep the border open e.g., skilled labor e.g., the largest vehicle market with high purchasing power Chance events
An extension: Multiple diamond model • The Finnish miracle: Nokia • Source: Anil Hira, 2012, “Secrets behind the Finnish miracle: the rise of Nokia”. International Journal of Technology and Globalization, 6(1/2), pp. 38-64.
The Finnish miracle: Nokia • Nokia • 2/3 of the Information and Communications Technology (ICT) sector in Finland • 1/5 of exports • 3–4% of GDP • 45% of business sector R&D (research and development), and 1/3 of national R&D • conducts 60% of its research in Finland • employs 20,000 in Finland, half of whom are in R&D • The Finnish ICT cluster includes 6000 firms, of which 200 are first-tier subcontractors of Nokia. ICT constitutes 10% of GDP (up from 4% in 1990).
The Finnish miracle: Nokia • The story of Nokia is compelling because Finland was not the context (in regard to natural comparative advantage) in which one would expect to see leadership as an international R&D hub. • Finland is an odd place for the emergence of a global competitor in IT. • a small domestic population of 5.2 million • a relatively remote location • a traditional economy based on natural resources (lumber, pulp, and paper) • Yet, there were signs of previous Finnish capacity to develop globally competitive products requiring high value-added and levels of skill, e.g., The School of Decorative Arts and the Society of Crafts and Design in Helsinki.
The Finnish miracle: Nokia • A double diamond model between Finland and the Soviet Union (SU) from 1950 and 1990 • The Soviet Union’s demand for reparations as a result of Finnish alliance with the Germans in WWII – $300 million (75% in telecom-related production, etc.). • Lack of foreign exchange led to increase in efficiency • Not eligible for the European Marshall Plan aid for tech transfers, motiving Nokia to build proprietary tech capacity • The SU accounted for 15-25% of Finnish foreign trade in 1950s some 40% in 1990, when the SU collapsed.
The Finnish miracle: Nokia • In 1967, with the encouragement of the government, the Nokia Corporation, including FCW, FRW, and the original Nokia wood mill activities, was officially launched. • Industry structure: • Good cooperation • 1964-71, Nokia – Salora Oy on radio and phone • 1975, Nokia – Salora on branding and promotion activities • 1979, Nokia – Solora built a joint venture of Mobira Oy (mobile radio), precursor of today’s Nokia Telecommunications (NTC) • Expanding military and public sector • 1969, expansion of highway traffic led to construction of a nationwide mobile network based on manual Car Mobile Telephone (CMT) technology • 1972, Post, Telephone and Telegraph public agency (PPT) offered the first mobile phone services on the CMT network • However, there was still significant gap in supply-demand. Private players such as Televa Oy entered into the business, which was taken over by Nokia in 1981.
The Finnish miracle: Nokia • The Nordic quadruple diamond model • The Nordic Mobile Telephone Group (Nordisk Mobil Telefon or NMT), including both private and public partners from Finland, Sweden, Norway, and Denmark, was established in 1969 to develop a new mobile telephone system. • Full automatic operation and charging • System and terminal compatibility among all four countries • Full roaming capability among all four countries • Mobile-to-mobile calls • High reliability • Similar use and same facilities as conventional fixed phone • Privacy protection • Open specs, with no exclusive supplier rights • By 1980s, the Nordic countries constituted the largest world market in terms of mobile phone subscribers. • By taking over Mobira, another Finnish mobile phone manufacturer, and Finland’s largest electrical wholesaler, and Swedish Ericsson Group’s data divison, Nokia became the largest IT group in Scandinavia. Ericsson’s data division Mobira
The Finnish miracle: Nokia • The European multiple (>4) diamond model • Nokia’s successful expansion in the Nordic countries led to Nokia’s shift of focus on the entire Europe • It started sourcing external finance in Switzerland • In 1982, promoted by the Nordic countries and the Netherlands, the European Conference of Postal and Telecommunications Administrations (CEPT), formed a new standards group, Groupe Special Mobile (GSM), to standardize the emerging wireless industry across Europe. • In 1987, Nokia joined the forces with France’s Alcatel and West Germany’s AEG to promote GSM as an European standard. • In 1988, the European Economic Community (EEC), the precursor of EU, as an European standard, which would become an international standard. • Finland became one of the earliest adopter of this pan-European standard by building nationwide GSM.
The SU-Finland double diamond 1950-90 The SU The SU industry structure and supporting institutions The SU-based resources The SU customers The rise of Nokia and wireless industry The SU government Finnish Government Finland-based resources Finnish customers Finnish industry structure and supporting institutions
The Nordic quadruple diamond since 1969s Swedish, Norwegian, and Danish Swedish, Norwegian, and Danish industry structure and supporting institutions Swedish, Norwegian, and Danish resources The Swedish, Norwegian, an Danish customers The rise of Nokia and wireless industry Swedish, Norwegian, and Danish governments Finnish Government Finland-based resources Finnish customers Finnish industry structure and supporting institutions
The European multiple (>4) diamond since 1980s Europe European industry structure and supporting institutions European resources European customers The rise of Nokia and wireless industry European government Finnish Government Finland-based resources Finnish customers Finnish industry structure and supporting institutions