Download
1 / 69
690 likes | 898 Vues
Topic 9 Trading Strategies for Options. Introduction. The purpose of this lecture it to introduce you to some of the basic strategies that an options trader might use.

E N D
Introduction • The purpose of this lecture it to introduce you to some of the basic strategies that an options trader might use. • Keep in mind that although we are examining these strategies in isolation, in reality you normally would execute them as part of a larger hedging or investment process. Only rarely would you simply implement these strategies for speculative purposes. • Also, this lecture is a blend of Hull’s chapter 9 and McDonald’s chapter 3.
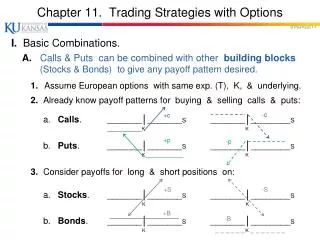
Elementary Trading Strategies • We can examine trading strategies relatively simply by examining the payoff diagrams to various option positions. • Combining these payoff diagrams is a very useful tool for understanding not only more complex positions, but also more complex options. • Let’s begin with call and put options with a strike of 100, and three months to maturity. Let’s assume that the premium paid for these options is $2 and $1.80, respectively, at time 0. • Our profit, therefore is the terminal payoff less the premium (assuming we are long), or the premium less terminal payoff if we are short.
Elementary Trading Strategies • As McDonald notes, the long call position allows us to cap our exposure to future price increases. • If we knew we wanted to purchase the stock at some point in the future (perhaps to cover a short position!), then one way we could insure that we would not get creamed by a rise in the price of the stock would be to purchase a long call, in which case we have capped our price risk.
Elementary Trading Strategies • McDonald points out that a long put position establishes a floor for the value of our stock. • If we own the stock and are worried that the price might fall, then by buying a put option we are establishing the minimum value that our net portfolio can take. • In this sense this is nothing more than an insurance policy. • Indeed, insurance companies are basically in the business of writing put options on various things: like lives, health, cars, houses, etc. • McDonald has a really neat notion about the relationship between insurance and puts. He points out that if you own the asset then buying a put reduces risk since the put pays off when the asset decreases in price. If you don’t own the asset, however, it increases your risk since you wind up adding volatility to your portfolio. • The really cool example is like buying homeowners insurance on your house versus buying homeowners insurance on your neighbor’s house.
Covered Positions • If you are going to write a call, frequently you will also hold the underlying asset to protect yourself against downside losses. This is called a covered call. • Frequently people holding a stock will write out of the money calls to “enhance” the income from the portfolio. Note that this gives you a net position that is very similar to that of a put option! • Buying a put on a stock that you hold (with a lower strike price) will give you some measure of insurance if the stock price goes down. • This is the basic idea of portfolio insurance! • It is called a “protective put”, and it has a payoff pattern very reminiscent of the payoff to the long call.
Spreads and Combinations • A spread is a strategy where you buy or sell positions in the same type of option. • A combination is a strategy where you buy or sell position in different types of options. • A bull strategy is one that is designed to make money when the market rises, and a bear strategy makes money when the market falls. • A volatility play makes money when there are large price swings in the market, regardless of the direction.
Spreads • Bull Spread: It is called this because the investor is hoping that the stock price will rise. • To construct: • Buy low strike call • Sell high strike call • Initial cash flow is negative to investor • Payoffs: • if terminal stock price < low strike: 0. • If low strike <terminal stock price < high stock price: ST - Klow. • If high stock price < terminal stock price: Khigh - Klow. • Example: An investor buys a $3 call with a strike of $30 and sells a $1 call with a strike of $35. The payoff from this bull spread strategy is $5 if the stock price is above $35 and zero when it is below $30, and ST-30 when between 30 and 35. The cost of the strategy is $2.
Spreads • It is worth considering a payoff diagram to a bull spread constructed with call options. 0
Spreads • Bull Spread using puts: • To construct: • Buy low strike • sell high strike • initial cash flow is positive to investor • Payoffs: • if terminal stock price < low strike: 0. • If low strike <terminal stock price < high stock price: ST - Klow. • If high stock price < terminal stock price: Khigh - Klow.
Spreads • Bear Spreads • With this strategy, the investor is hoping the stock price will fall. • To construct: • buy call option at high strike price • sell call option at low strike price. • Initial cash flow is positive to investor • Payoffs: • ST<KLOW, -(Khigh - KLOW) • Klow<ST<Khigh, -(ST-Klow) • ST>Khigh, 0
Spreads • “Real World” Example of a bull spread. • We will actually look at several examples of types of spreads. For all of these we will use options on IBM. • The following graph shows IBM’s stock price last year (well, at least through September 22, 2003.)
Spreads • So let’s say that we were fortunate on August 19, 2003 to decide to put on a bull spread using IBM options. • IBM was selling for 83.52 per share. • Remember how to construct bull spread: buy a low strike option and sell a high strike option. • Let’s say that we decided to construct this spread using the September options with strike prices of $80 and $85, respectively. • The September 80 option had a price of $4.20/share. • The September 85 option has a price of $1.20/share.
Spreads • So we buy 1 options contract at $4.20 per share, and then we sell 1 options contract at $1.20 per share. • Net cashflow: 100*(-4.20 + 1.20) = $-300. • We note that on September 4, IBM was selling at $86.33/share, so we decide to close our position. So we sell our holdings of the September 80 and then buy a September 85 option contract (to “cancel” the short September 85 contract we have.) • September 80 price : $6.6/share. • September 80 price: $2.45/share. • Net cash flow on September 4: 100*(6.60 – 2.45) = $415.
Spreads • So we invested $300 on August 19, and received $415 on September 4. • Our simple, un-annualized return was • (415-300)/300 = 38.33% • Annualizing (and using continuous compounding), the rate of return is 740.25%! • Compare this to if we had just purchased a share of the stock. • Our simple, un-annualized return would have been: (86.33 – 83.52)/83.52 = 3.36% • Our annualized return was (only) 75.48%.
Spreads • What if we had not closed out our position on September 4, but instead held them until the expiration of the contracts, which would have been on September 19? • On that day IBM traded at a price of 92. So our payoff on the September 80 contract would have been $12/share, or $1200, and we would have had to pay $7/share or $700 on the September 85 contract that we were short. • Net effect is we would have received $500, for $200 profit on a $300 investment!
Spreads • Of course, it could have happened that the price of IBM could have fallen. • What would have happened if the price of IBM had fallen to $75 on September 19? • Both options would have expired worthless, so there would have been no cash flow on September 19th. • We could keep the $120 we earned from selling the September 85 option, but we would lose the $420 we paid for the September 80 option. • Net effect is that we would be out $300. An infinitely negative return!
Spreads • When an investor puts on a Bull or Bear spread they are fundamentally taking a position on the direction of the stock. • Sometimes an investor would rather take a position not on the direction of movement, but rather on whether the stock will move much at all. • This is known as a volatility play. • It is perhaps easiest to start by seeing what would happen if the investor felt that the stock was UNLIKELY to move very much and wanted a position that would pay off if the stocks price pretty much stayed the same: • One approach would simply be to write a call option that was deeply out of the money. • The drawback to that approach is that if volatility turns out to be high, you could lose a potentially unlimited amount of money.
Spreads • A commonly used approach in such cases is to implement a “butterfly” strategy. • To implement this strategy: • Buy a call option at the relatively low strike of K1. • Buy a call option at the relatively high strike of K3. • Sell two call options at strike K2, which is halfway between K1 and K3. • The two long positions are the “wings” of the butterfly and the short position is the “body”. • The payoff diagram to a generic butterfly is shown on the following page.
Spreads • Clearly, then you are taking a position the nets you money when there is very little volatility in the stock. • You are generically said to be “selling volatility” when you have this type of position. • Of course you could also take the opposite position, if you felt that volatility was likely to be high. • Sell one call option at K1. • Sell one call at K3. • Buy two calls at K2. • You will get an “inverted butterfly pattern.
Spreads • One issue that Hull points out on page 197, is that if you bring K1, K2, and K3 to be very close to each other, the “hump” of a butterfly spread becomes a “spike”. Indeed, you could actually set it up so that you will get a payout only if the stock ended at K2 exactly. • This means that you could create pure “state” securities with a butterfly spread. What this means is that, given enough butterfly spreads, you could replicate any other security in the market.
Spreads • There are other types of spreads available such as the calendar spread. • Sell a call with strike K and maturity T1. • Buy a call with strike K and maturity T2, where T1<T2. • This spread will net cost money at time 0. • Generically they allow you to either make a volatility play (as the pure calendar spread does), or they let you make a play on the direction of the market. • The key to the calendar spread is to realize that at time T1 the long call will have a higher value than will the short call (which matures at that day).
Spreads • So, let us work an example. We begin with a stock with a price of $85 and we set the strike on the two options at $85. Let T1=1 month, and let T2= 3 months. • Also, we assume volatility is 25%, r=10%. • The price for option 1 will be 2.62, and the price for option 2 will be 4.75 (using Black-Scholes). • We short option 1, earning 2.62, and we go long option 2, so we have to pay 4.75, thus at time 0 we must pay (2.62-4.75=-2.13) • One month later, the option we are short expires, generating the following payoffs to us:
Spreads • There is another type of spread that McDonald discusses, the Box spread. • The idea behind the Box spread is that you use options to synthetically create a long forward at one price and to synthetically create a short forward at a different price. • This can actually guarantee a positive cash flow in the future (but obviously at a cost today). The net effect is that you are simply borrowing or lending money. • Example 3-3 from McDonald: • Buy a 40-strike call and sell a 40-strike put, and also • Sell a 45-strike call and buy a 45 strike put.
Spreads • First, let’s graph the long call and short put written at $40:
Spreads • Next, let us add in the $45 strike positions (remember, that is a short call at $45 and a long put at $45).
Spreads • So we can see that the net effect is that we are always earning $5 at termination…
Spreads • Finally, there is another type of spread that McDonald mentions, known as the ratio spread. • In this type of spread you buy m calls at one strike and sell n calls at a different strike. (You could also work out equivalent positions using puts.) • What is neat is that you can work this out to provide a position that is initially costless and will generate positive cash flows for in some circumstances. • To see this, consider if a stock were selling today at $85, and had volatility of 25%, and r were 10%. According to the Black-Scholes, the price of a call option with a strike of $90 would be $2.66, and the price of a call with a strike of $95 would be 1.36.
Spreads • Assume now that you bought 1 call at 90, for $2.66, and sold 1.952 calls at $95 for 1.36 each. • At time 0 your cash out would be: • 1.952*1.36 – 2.66 = 0 • At maturity, if the stock ended at less than 90, your two options would each expire worthless, in which case you would have 0 cash flow. • If the stock ended between 90 and 95, you would exercise your long position, but the short would expire worthless, so you have a positive cash flow. • Above $95, the short call would come into play, but as long as the stock remained below (roughly) $100, you make a positive return. • Above $100, however, and your losses quickly become large.


![[PDF READ ONLINE] Options Trading Strategies: 2 Books in 1: Options Trading for Beginners: The](https://cdn7.slideserve.com/12579025/slide1-dt.jpg)