Download
1 / 29
290 likes | 437 Vues
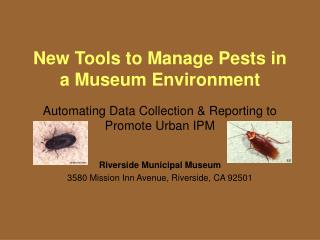
New Tools to Manage Pests in a Museum Environment. Automating Data Collection & Reporting to Promote Urban IPM Riverside Municipal Museum 3580 Mission Inn Avenue, Riverside, CA 92501. Riverside Municipal Museum 3580 Mission Inn Avenue Riverside, CA 92501. Mission Statement.

E N D
New Tools to Manage Pests in a Museum Environment Automating Data Collection & Reporting to Promote Urban IPM Riverside Municipal Museum 3580 Mission Inn Avenue, Riverside, CA 92501
Riverside Municipal Museum3580 Mission Inn Avenue Riverside, CA 92501
Mission Statement Provide integrated pest management solutions that are effective, economical, environmentally friendly, and most importantly, do not have the harmful side effects of many conventional pest management techniques that rely solely on insecticides. “SPLAT” dispenser emulsion “Smart trap” circuit board Pheromone septa
Objectives for Urban IPM Project • Immediate: • Simplify & reduce time required to… • Collect field data • Process and analyze data (combining with computer models and algorithms to estimate pest population densities) • Generate Reports • Long-range: • Develop a device or system that automates the identification process • Provide IPM strategies for each pest species based on specific environmental parameters
Pest Monitoring & Reporting • Pest Records • Presence / Absence • Identification • Density • Distribution • Decision Making • Control Measures - Are they needed? If so: Where, When, How much? • Effectiveness
Problems Inherent with IPM • Information Collection: Labor intensive monitoring is the backbone to any sound IPM program. • Status of pest • Condition of building (torn screens, doors left ajar etc.) • Effect of control strategies • Action to be Taken • What should be done based on data collected? • How do you implement IPM?
Collect Building Structure Info • Integrity of building (excluding pests) • Maintenance (general upkeep of building)
Identify Pests • IPM hinges on proper identification of pest • For example Ants: • Carpenter ant (nests in but doesn’t consume rotten wood) • Argentine ant (protein food source) will nest indoors • Pavement ant (seeks sugary food source) nests outdoors
Tabulate information • Number of each pest at distinct developmental stage • Location • Date
Data Entry • Simple, non-relational database application • Temporal records, but with no truly spatial context
Analysis & GraphicalPresentation of Data • What information needs to be presented? • What information is pertinent? • How do you process information?
MoritorPest Management Information System • Semi-automation of field data collection • Automated data transfer to computer • Automated analysis & reporting including: • Graphs • Pest density maps • Recommended IPM strategies
Moritor Components • Desktop companion – installed on office computer • Pocket PC or Palm Pilot – used to collect field information • Handheld can be equipped with either: • Scanner • GPS
Moritor - Pest Management Information System • Data transferred from desktop computer to centralized database • Data processed and analyzed by ISCA • Automated reports - depicting pest information and suggesting IPM control strategies • Centralized database enables easy access to data by authorized users, and allows for easy comparisons of pest problems between institutions • Collect field data using Pocket PC • Synchronize data on handheld with desktop unit
Advantages of Moritor • Shortens the data management processing time from weeks to hours or minutes • Allows managers to stop pest problems as soon as they are detected, thus avoiding crisis pest management weeks later, and resulting in significant cost savings from the reduction in pesticide use
Field Data StructureMoritor Desktop Companion All variables have specific parameters, for example… • Building: • Name • Type of construction • Type of climate control
Field Data StructureMoritor Desktop Companion • Rooms can similarly be assigned • Names • Types • Size & heights (volume)
Field Data StructureMoritor Desktop Companion • Most important… • Traps are not only named, but assigned descriptors that allow for efficacy testing
Field Data StructureMoritor Desktop Companion • Moritor’s initial set-up is a one time event! vs. • Traditional: Need to write in variables during each data collection event
Data Collection with Pocket PC • Each Variable has a drop down list
Data Collection with Pocket PC • Select trap from list and if equipped with GPS unit, enter the GPS coordinates
Data Collection with Pocket PC • Enter species information • Species ID • Number • Sex • Developmental stage
Data Collection & Reporting • Data entered in handheld device • Dowloaded to ISCA database • Following analysis, report provided to client with charts of pest densities, recommendations for treatment, etc.
Data Collection & Reporting • Pest Reporting will ultimately include: • Density maps as well as charts • Proposed control strategies • Automated pest identification data analysis • Graphical presentation of data collected in GIS format, providing more “real world” views of problems…
Data Collection & Reporting Analysis of pest density patterns over time(Time series analysis) Colusa Sutter Yolo San Joaquin Stanislaus Merced Fresno Tulare Kings Kern
Reporting IPM Information • Pest Occurrences vs. Structural Integrity of Building • Screens • Door sweeps • Pipes through walls
Conclusion • This collaboration will continue, with implementation of the field data gathering model, and downloading of existing Museum data to ISCA database • Analysis and reporting methodologies will be developed, based on ISCA urban IPM resources • Over the next year, “smart trap” strategies will be developed along with GIS data methodologies, resulting in full implementation of the project concept