Precision & Accuracy
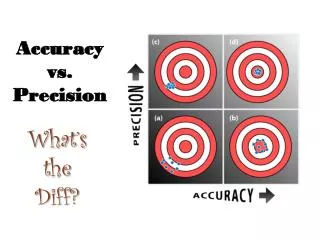
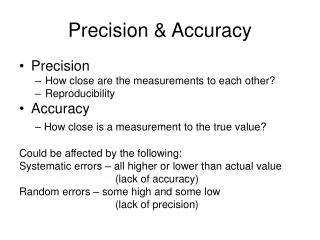
Precision & Accuracy. Precision How close are the measurements to each other? Reproducibility Accuracy – How close is a measurement to the true value? Could be affected by the following: Systematic errors – all higher or lower than actual value (lack of accuracy)

Precision & Accuracy
E N D
Presentation Transcript
Precision & Accuracy • Precision • How close are the measurements to each other? • Reproducibility • Accuracy – How close is a measurement to the true value? Could be affected by the following: Systematic errors – all higher or lower than actual value (lack of accuracy) Random errors – some high and some low (lack of precision)
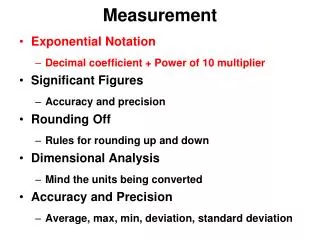
Significant Figures • Presenting measurements and calculated results with the appropriate significant figures and units is an indication of the precision of values.
Rules for Sig Figs • All nonzero digits are significant • Trapped zeros are significant • Trailing zeros are significant if there is a decimal point • Leading zeroes are NOT significant # sig figs 1 3 4 1 2 3 300 300. 300.0 0.003 0.0030 0.00300 How would one write 300 with 2 sig figs?
Scientific Notation 3.0 x 10 2 has two sig figs Written as a number between 1-10 x a power of ten Unambiguously displays the precision of the value making it easier to make comparisons 300 3 x 10² 300. 3 .00 x 102 300.0 3.000 x 10² 0.003 3 x 10⁻³ 0.0030 3.0 x 10⁻³ 0.00300 3.00 x 10⁻³
Making Measurements - Thermometer The number of significant figures in your measurement depends on the measuring device. 87.5±.1°C The bottom of the meniscus is between 87 and88 ° C. This can be read to 1 digit more precision than indicated by the calibration. The last estimated digit can vary from person to person, but each should record a value to the tenth’s place. There are 3 sig figs and the last digit is the uncertain digit. Generally, measurements are uncertain by ± 1 in that last digit unless otherwise indicated by your measuring device. Usually, 1/10 of an increment.
Beaker vs. Graduated Cylinder Each contains the same amount of water.
Beaker 10. ± 1mL
Graduated Cylinder 10.05 ± .05 mL
The Analytical Balance All digits should be recorded as given, precision is to the 0.1 mg, & the accuracy is determined by the calibration.
Calculations & Sig Figs • Multiplication & Division The total number of sig figs in the answer is equal to the same number of sig figs in the measurement used in the calculation with the smallest number of sig figs. Ex: 5.1 cm x 2.01 cm = 10.0701 cm2 = 10. cm2 • Round the final answer using the number to the right of the last sig fig. • Avoid round off errors by keeping extra digits beyond the last sig fig when calculating intermediate values.
Calculations & Sig Figs • Addition & Subtraction The final answer should be rounded to the right-most filled column (according to the value with the biggest uncertain digit – the weakest link). Ex: 6.5 cm 100.01 cm + .044 cm 106.554 cm = 106.6 cm
“Scientific notation” can make it easier….. • What is the sum of 4.5 x 10⁻⁶, 3.2 x10⁻⁵, and 15.2 x 10⁻⁷? .45 x 10-5 3.2 x 10⁻⁵ .152 x 10-5 3.802 x 10-5 = 3.8 x 10⁻⁵
SI Prefixes Prefix Symbol Meaning Power of 10 Mega M 1,000,000 106 Kilo k 1,000 103 Deci d 0.1 10-1 Centi c 0.01 10-2 Milli m 0.001 10-3 Micro μ 0.000001 10-6 Nano n 0.000000001 10-9 Femto f 0.00000000000000110-15 Atto a 0.00000000000000000110-18
Fundamental SI Units Physical Quantity Unit Abbreviation Mass kilogram kg Length meter m Time second s Temperature kelvin K
Dimensional Analysis • Use conversion factors (definitions, ratios) to convert from one unit to another. • Conversion factors are exact numbers that have no uncertainty. • Ex. Convert 6.4 weeks to hours. 6.4 weeks x 7 days x 24 hours = 1100 hrs 1 week 1 day
Group Problems • Convert 47 hours to weeks. 47 hours x 1 day x 1 week = 0.28 weeks 24 hours 7 days The same conversions were used as in the previous example. The top equals the bottom. Round off answers at the end. Keep additional sig figs for intermediate answers. • Calculate the sum of 2.5 + 3.5 + 4.5 +5.5. 2.0 3.5 4.5 5.5 14.5 • The tread on a certain automobile tire wears 0.00100 inches per 2,600 miles driven. If the car is driven 45 miles a day, how many months ( 1mo = 30 days) can a tire w/ 0.010 in of treat be used before it wears down and needs to be replaced? .010in x 2,600 mi x 1 day x 1 month = 19.25 = 19 months 0.00100in 45 mi 30 days • In a displacement of water by gas experiment the initial volume of water in a burette is 45.50 mL and the final volume is 37.50 mL. What is the total volume of water displaced? In mL? in L? 45.50 (4sf) - 37.50 mL (4sf) 8.00 mL (3sf) = 0.00800 L (still 3sf)
Statistical Analysis and Expression of Data The mean or average Reading: Lab Manual 29 - 40 Today: Some basics that will help you the entire year = true value, measurements ≈ true value, finite # of measurements Uncertainty given by standard deviation
For finite # of measurements Standard deviation: S σ≈ S = [(xi-x)2/(n-1)]1/2 (Calculators can calculate & σ quite easily!!! Learn how to do this on your calculator.) For small number of measurements σ≈ S is very poor. Must use Student t value. σ≈ tS; where t is Student t Usually use 95% Confidence Interval So, 95% confident that if we make a measurement of x it will be in the range x ± t95s Uncertainty of a SINGLE MEASUREMENT
Usually interested in mean (average) and its uncertainty Standard Deviation of the mean Then average and uncertainty is expressed as x ± t95Sm Often want to know how big uncertainty is compared to the mean: Relative Confidence Interval (C.I.) = (Sm / x )(t95) Expression of experimental results: 1. Statistical Uncertainties (S, Sm, t95S, Sm (t95) / x) always expressed to 2 significant figures 2. Mean (Average) expressed to most significant digit in Sm (the std. dev. of the mean)
Example Measure 3 masses: 10.5763, 10.7397, 10.4932 grams Average = 10.60307 grams Std. Dev. S = .125411 = .13 grams Sm = .125411 / 3 = .072406 = .072 grams Then average = ? = 10.60 grams t95 for 3 measurments 95% C.I. = t95Sm = 4.303 * .072406 = .311563 = .31 grams of the mean Relative 95% C.I.of the mean = ? = 95 % C.I. / Average = .311563/10.60307 = .029384 = .029 of the mean Usually expressed at parts per thousands (ppt) = .029 * 1000 parts per thousand = 29 ppt = Relative 95% C.I. of the mean What if measure 10.5766, 10.5766, 10.5767 grams? Ave. = 10.57663; Sm = .000033 Ave. = ? Ave. = 10.5766, not 10.57663 because limited by measurement to .0001 grams place Now work problems.
Sally 5 times, average value of 15.71635% ; standard deviation of 0.02587%. Janet 7 times, average value of 15.68134% ; standard deviation of 0.03034%. (different technique) Express the averages and standard deviations to the correct number of significant figures. Must use Sm. Sally: Sm = 0.02587/5 = 1.157 x 10-2 = 1.2 x 10⁻²% Janet: Sm = 0.03034/7 = 1.147 x 10-2 = 1.1 x 10⁻²% Sally: 15.72%; S = 0.026% Janet: 15.68%; S = 0.030% Using the proper statistical parameter, whose average value is more precise? Must use Sm. Sm(Janet) < Sm(Sally) so Janet’s average value is more precise. 95% confidence intervals of the mean, relative 95% confidence intervals of the mean Sally: 95% C.I. = ±t95Sm = ±2.776 (1.157 x 10⁻²) = ±3.21 x 10⁻²% = ±3.2 x 10⁻²% Range = 15.69 – 15.75% Relative 95% C.I. = 3.21 x 10⁻² / 15.71635 * 1000 ppt = 2.04 = 2.0 ppt Janet: 95% C.I. = ±t95Sm = ±2.447(1.147 x 10⁻²) = ±2.81 x 10⁻²% = ±2.8 x 10⁻²% Range = 15.65 – 15.71% Relative 95% C.I. = 2.81 x 10⁻² / 15.68134 * 1000 ppt = 1.79 = 1.8 ppt
Are the two averages in agreement at this confidence level? Because the 95% C.I. for both measurements overlap, the two averages are in agreement If you owned a chemical company and had to choose between Sally’s and Janet’s technique, whose technique would you choose and why? Choose Sally’s techniques because the uncertainty in a single measurement based on S is better than that using Janet’s technique.