Download
1 / 4
40 likes | 162 Vues
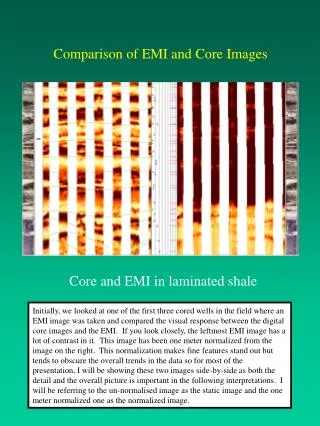
Comparison of EMI and Core Images. Core and EMI in laminated shale.

E N D
Comparison of EMI and Core Images Core and EMI in laminated shale Initially, we looked at one of the first three cored wells in the field where an EMI image was taken and compared the visual response between the digital core images and the EMI. If you look closely, the leftmost EMI image has a lot of contrast in it. This image has been one meter normalized from the image on the right. This normalization makes fine features stand out but tends to obscure the overall trends in the data so for most of the presentation, I will be showing these two images side-by-side as both the detail and the overall picture is important in the following interpretations. I will be referring to the un-normalised image as the static image and the one meter normalized one as the normalized image.
Comparison of EMI and Core Images Core and EMI in laminated shale It is possible to see the shale-sand boundary in both the EMI image and in the core. You may notice that the EMI image of the boundary between the sand and shale is off depth from the same boundary in the core. This is actually quite common as the core can swell quite a bit once it is brought back to the lab to be photographed. We actually have matched the depths in the slides to come.
Comparison of EMI and Core Images Core and EMI in crossbedded clean sand On this slide, I've shown a very clean crossbedded sand section that shows how the electrical image, once enhanced often shows more features than the core harvested from the identical interval. Even with the core photograph enhanced to the point where there are artificial white patches appearing in the image, no crossbedding is apparent in the core. This is not to downplay the effect of having both the core and the image for an interpretation as often in the shaly core sections, the features are much more visible in the core than in the electrical image. In the clean sand sections such as this one, however, we were happy that the features in the EMI images were often easier to identify than in the core.
Comparison of EMI and Core Images Core and EMI in crossbedded clean sand With this qualitative comparison between the EMI and the core done, we were content that the tool accurately reflected the downhole tarsands environment so we proceeded on to the next objective.