Download
1 / 19
200 likes | 355 Vues
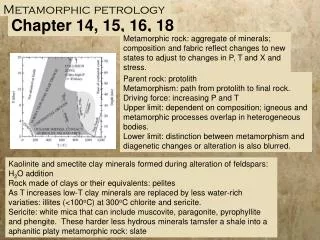
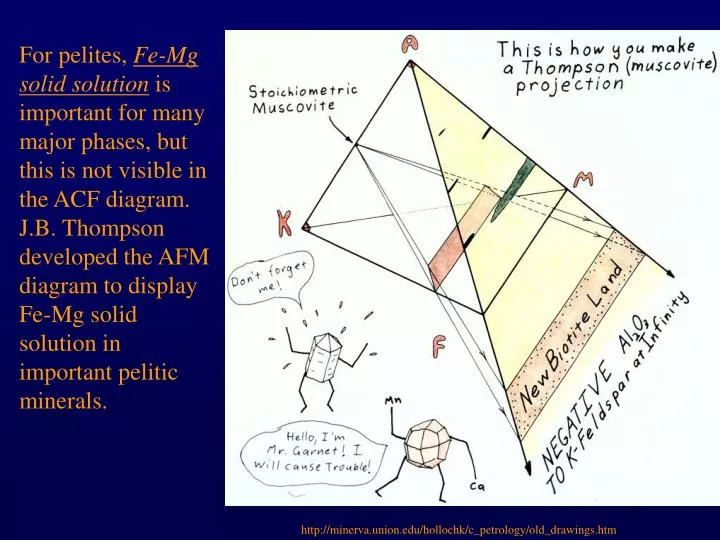
For pelites, Fe-Mg solid solution is important for many major phases, but this is not visible in the ACF diagram. J.B. Thompson developed the AFM diagram to display Fe-Mg solid solution in important pelitic minerals. http://minerva.union.edu/hollochk/c_petrology/old_drawings.htm.

E N D
For pelites, Fe-Mg solid solution is important for many major phases, but this is not visible in the ACF diagram. J.B. Thompson developed the AFM diagram to display Fe-Mg solid solution in important pelitic minerals. http://minerva.union.edu/hollochk/c_petrology/old_drawings.htm
Note that Qtz + Muscovite must be part of the mineral assemblage to use the AFM diagram. A modified version is used for rocks that have K-feldspar instead of muscovite (see your text). http://minerva.union.edu/hollochk/c_petrology/old_drawings.htm
Discontinuous Reaction: Tie-Line Switch Consider a metamorphic system of bulk composition x. For this system, quartz and muscovite are part of the mineral assemblage but not shown on the diagram. What is the stable assemblage at the start of the reaction? At the end? Don’t forget the phases that are present but not plotted on the diagram! What is the (approximate) reaction? This reaction occurs in meduim grade pelites, and is thought to be responsible for the appearance of staurolite and the disappearance of chlorite in typical pelites.
Discontinuous Reaction: Terminal Disappearance In this case, staurolite disappears. What is the new assemblage for composition “z”? What new index mineral will appear from this reaction? In this case, reaction represents increasing P and T (higher grade). Also involves dehydration.
Continuous or Divariant Reaction Type 3: Involves the gradual change in the composition of the minerals in a system and the ultimately, potential disappearance of a mineral. Because change is gradual and does not ALWAYS result in disappearance of a mineral, called continuous or divariant.
Continuous or Divariant Reaction + quartz and muscovite • For the AFM diagram shown above, in addition to muscovite and quartz, the stable three phase mineral assemblage is • garnet + chlorite + biotite
Continuous or Divariant Reaction + quartz and muscovite • Note that all three minerals have solid solutions that involve Fe and Mg. • How do we know this?
Continuous or Divariant Reaction + quartz and muscovite • So in this continuous reaction, the mineral compositions GRADUALLY change, for example, from more Fe-rich to more Mg-rich compositions (which is toward higher temperature). This is noted by a gradual change in the position of the triangle as it shifts from left to right on the diagram.
Continuous or Divariant Reaction + quartz and muscovite • If you consider the bulk composition x, then as the minerals become more Mg-rich, you’ll note that it is possible that eventually, there will be no chlorite in the system. • You can tell this because as the mineral compositions shift right, eventually the bulk composition x (which does NOT move) will intersect the tie line between garnet and biotite. • This means there is no chlorite in the system. All of the chlorite has been reacted away.
A petrogenetic grid is simply a collection of ternary triangles (showing stability of a certain group of three minerals) plus some reaction boundaries (which show exactly where in P-T space the reaction occurs). So a petrogenetic grid tells us: Potentially stable mineral assemblages (mineral assemblages that are in equilibrium at particular P, T, X) Potential reactions that might occur with changing conditions. Petrogenetic Grid
Petrogenetic Grid Note: three phase triangles, which tell us which minerals are stable. “Reaction lines” which tell us what minerals are reacting. These are also called phase boundaries.
Petrogenetic Grid Let’s look at an example: Consider a system undergoing a change in temperature from ~550 °C to ~750°C at ~12.5 kbars. For each distinct divariant region (the regions between the phase boundaries), what is the three phase mineral assemblage and at each phase boundary, what is the relevant reaction?
Petrogenetic Grid Using a diagram like this, I could ask you to identify index minerals as metamorphic grade increases.
We try to understand metamorphic regions because they provide information about P-T-X conditions. To understand changes in conditions, we apply chemographic diagrams, which tell us about minerals that may be stable in a particular part of a metamorphic terrane. To understand metamorphic reactions, we also use these diagrams. We need to recognize and understand the three types of reactions and what these might tell us about changes in mineral assemblage within a particular metamorphic region. A petrogenetic grid is a more complex way of understanding changes in a particular metamorphic region. Summary
Compare the H2O content of the Cascadia slab and the NE Japan slab at various depths. At what depth does the most significant fluid release occur in each case? Not modeled in white areas 1 2 3 4 5 6 NE Japan Cascadia