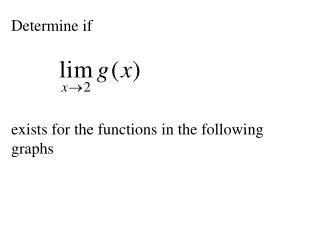
Determine if
Determine if. exists for the functions in the following graphs. Infinity and Limits Consider the function f(x) whose graph is. As x increases, the value of f(x) approaches 2. In this case, we say that the limit of f(x) as x approaches infinity is 2. We express this using limit notation as.

Determine if
E N D
Presentation Transcript
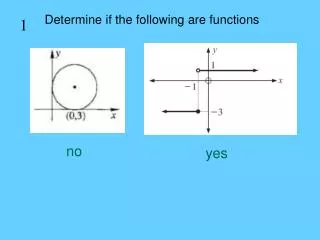
Determine if exists for the functions in the following graphs
Infinity and Limits Consider the function f(x) whose graph is As x increases, the value of f(x) approaches 2.
In this case, we say that the limit of f(x) as x approaches infinity is 2. We express this using limit notation as
Similarly, if we examine the following graph, we will note that as x grows large in the negative direction, the value of f(x) approaches 0.
If a is a constant, we say that f(x) is differentiable at x = a if we can evaluate the following limit to determine f 0(a). Conversely, if this limit does not exist, then f(x) is nondifferentiable at x = a.
There are many geometric representations of f(x) for functions that are nondifferentiable at x = a. These can result if f(x) has no tangent line at x = a, or if f(x) has a vertical tangent line at x = a.
A railroad company charges $10 per mile to haul a boxcar up to 200 miles and $8 per mile for each mile exceeding 200. In addition, the railroad charges a $1000 handling charge per boxcar. Graph the cost of sending a boxcar x miles.
If x is at most 200 miles, then the cost C(x) is given by: C(x) = 1000 + 10x dollars If x exceeds 200 miles, then the cost will be C(x) = 3000 + 8(x – 200) = 1400 + 8x So the function C(x) is given by
Continuity is closely related to the concept of differentiability. We say that a function is continuous at x = a if its graph has no breaks or gaps as it passes through the point (a, f(a)). If a function f(x) is continuous at x = a, it should be possible to sketch its graph without lifting the pencil from the paper at the point (a, f(a)).
The following graphs depict functions that are not continuous.
If f(x) is differentiable at x = a, then f(x) is continuous at x = a. So, a function that is differentiable at x = a will be continuous at x = a. Note however, it is still possible for a function to be continuous at x = a, but not differentiable.
Expressing continuity in terms of limits, we have the Limit Definition of Continuity A function f(x) is continuous at x = a provided the following limit relation holds:
In order for this to hold, three conditions must be fulfilled. • f(x) must be defined at x = a • must exist • The limit must have the value f(a)