Master Thesis Seminar , 2010
30 likes | 217 Vues
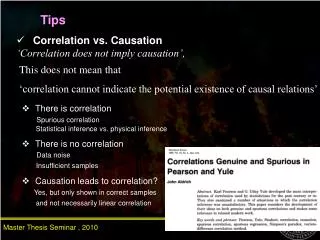
Tips. Correlation vs. Causation ‘Correlation does not imply causation’,. This does not mean that ‘correlation cannot indicate the potential existence of causal relations’. There is correlation Spurious correlation Statistical inference vs. physical inference

Master Thesis Seminar , 2010
E N D
Presentation Transcript
Tips • Correlation vs. Causation • ‘Correlation does not imply causation’, This does not mean that ‘correlation cannot indicate the potential existence of causal relations’ • There is correlationSpurious correlation Statistical inference vs. physical inference • There is no correlationData noiseInsufficient samples • Causation leads to correlation?Yes, but only shown in correct samples and not necessarily linear correlation Master Thesis Seminar , 2010
Tips • Correlation coefficients • Pearson r • Spearman • Kendall ‘The Pearson and Spearman’s coefficients are mathematically identical, except that the Spearman rank coefficient is calculated from the ranks of each variable, not the actual values.’Pearson: parametric, for quantitative data. Directly related to the OLMSpearman: non-parametric, rank-based, qualitative data.Kendall: non-parametric, rank-based, qualitative data. Master Thesis Seminar , 2010
Tips • AIC vs. BIC AIC=-2*ln(likelihood)+2*pBIC=-2*ln(likelihood)+ln(N)*p In generalized linear correlation for the within-region analysis, p (=1) and N (50% samples) are the same for each variable. Therefore, the variable ranks by AIC and BIC are the same. For the among-region comparison, BIC will be better than AIC. While N is problematic and subjective AIC and BIC reach different results in model selection CIC? Master Thesis Seminar , 2010