Download
1 / 23
230 likes | 368 Vues
Consider the Evidence. Evidence-driven decision making for secondary schools A resource to assist schools to review their use of data and other evidence 8 Collated examples. Evidence-driven teaching.

E N D
Consider the Evidence Evidence-driven decision making for secondary schools A resource to assist schools to review their use of data and other evidence 8 Collated examples
Evidence-driven teaching I had a hunch that Ana wasn’t doing as well as she could in her research assignments, a major part of the history course. What made me think this? Ana’s general work (especially her writing) was fine. She made perceptive comments in class, contributed well in groups and had good results overall last year, especially in English. How did I decide what to do about it? I looked more closely at her other work. I watched her working in the library one day to see if it was her reading, her use of resources, her note taking, her planning, or what. At morning tea I asked one of Ana’s other teachers about Ana’s approach to similar tasks. I asked Ana if she knew why her research results weren’t as good as her other results, and what her plans were for the next assignment. I thought about all of this and planned a course of action. I gave her help with using indexes, searching, note taking and planning and linking the various stages of her research.
What can we do with evidence? Shane’s story A history HOD wants to see whether history students are performing to their potential. She prints the latest internally assessed NCEA records for history students across all of their subjects. As a group, history students seem to be doing as well in history as they are in other subjects. Then she notices that Shane is doing very well in English and only reasonably well in history. She wonders why, especially as both are language-rich subjects with many similarities. The HOD speaks with the history teacher, who says Shane is attentive, catches on quickly and usually does all work required. He mentions that Shane is regularly late for class, especially on Monday and Thursday. So he often misses important information or takes time to settle in. He has heard there are ‘problems at home’ so has overlooked it, especially as the student is doing reasonably well in history.
Shane’s story (cont...) The HOD looks at the timetable and discovers that history is period 1 on Monday and Thursday. She speaks to Shane’s form teacher who says that she suspects Shane is actually late to school virtually every day. They look at centralised records. Shane has excellent attendance but frequent lateness to period 1 classes. The HOD speaks to the dean who explains that Shane has to take his younger sister to school each morning. He had raised the issue with Shane but he said this was helping the household get over a difficult period and claimed he could handle it. The staff involved agree that Shane’s regular lateness is having a demonstrable impact on his achievement, probably beyond history but not so obviously. The dean undertakes to speak to the student, history teacher, and possibly the parents to find a remedy for the situation.
Shane’s story - keys to success The history HOD looked at achievement data in English and history. She looked for something significant across the two data sets, not just low achievement. Then she asked a simple question: Why is there such a disparity between in these two subjects for that student? She sought information and comments (perceptions evidence and data) from all relevant staff. The school had centralised attendance and punctuality records (demographic data) that form teacher could access easily. The action was based on all available evidence and designed to achieve a clear aim.
Appraisal EVALUATION DATA asTTle writing results improve by … Perception data from Yr 9 staff indicates … Evaluation of effectiveness of range of shared strategies, barriers and enablers … etc INDICATORS FROM DATA asTTle scores show a high proportion of Yr 9 achieving below curriculum level NCEA results show high non- achievement in transactional writing Poor results in other language NCEA standards etc ANNUAL PLAN Develop and implement a plan to raise levels of Writing at Year 9 Development plan to be based on an analysis of all available data and to include a range of shared strategies etc YEAR TARGET Raise writing asTTle results Yr 9boys from 3B to 3A etc STRATEGIC GOAL To raise the levels of writing across the school Strategic action Develop a writing development plan which addresses writing across subjects and levels , including targets, professional development and other resourcing needs etc P D Self review School charter Evidence-driven strategic planning .
A teacher has a hunch - poor writers might spend little time on homework Explore data Survey of students shows that this is only partially true Reflect How will we teach writing in the future? Trigger Significant numbers not achieving well in writing Question What are the characteristics of students who are poor at writing? Evaluate Has writing improved? Analyse NQF/NCEA results by standard Intervene Create multiple opportunities for writing; include topics that can use sport as context; connect speaking and writing. PD for staff. Assemble more data & other evidence: asTTle reading, homework, extracurric, Attendance, etc Interpret information Poor writers likely to play sport, speak well, read less, do little HW Analyse non NQF/NCEA data and evidence The evidence-driven decision making cycle .
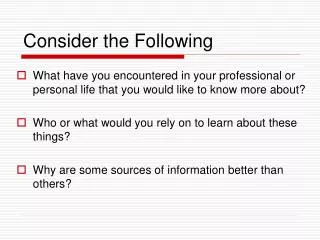
More purposeful questions • How do year 11 attendance rates compare with other year levels? Do any identifiable groups of year 11 students attend less regularly than average? • Is thenew 6-day x 50-min period structure having any positive effect on student engagement levels? Is it influencing attendance patterns? What do students say? • Should we be concerned about boys’ writing? If so, what action should we be taking to improve the writing of boys in terms of the literacy requirements for NCEA Level 1? • The new timing of the lunch break was intended to improve student engagement levels after lunch. Did it achieve this? If so, did improvements in student engagement improve student achievement? Do the benefits outweigh any disadvantages?
Assembling the evidence • We want to know if our senior students are doing better in one area of NCEA biology than another. So … we need NCEA results for our cohort. • It could be that all biology students do better in this area than others. So … we also need data about national differences across the two areas.
Are our data any good? A school found that a set of asTTle scores indicated that almost all students were achieving at lower levels than earlier in the year. Then they discovered that the first test had been conducted in the morning, but the later test was in the afternoon and soon after the students had sat a two-hour exam.
Think critically about data • Was the assessment that created this data assessing exactly what we are looking for? • Was the assessment set at an appropriate level for this group of students? • Was the assessment properly administered? • Are we comparing data for matched groups?
Cautionary tale 1 You want to look at changes in a cohort’s asTTle writing levels over 12 months. Was the assessment conducted at the same time both years? Was it administered under the same conditions? Has there been high turnover in the cohort? If so, will it be valid to compare results?
Cautionary tale 2 You have data that show two classes have comparable mathematics ability. But end-of-year assessments show one class achieved far better than the other. What could have caused this? Was the original data flawed? How did teaching methods differ? Was the timetable a factor? Did you survey student views? Are the classes comparable in terms of attendance, etc?
Hunches from raw data • Is the class as a whole doing better in internally assessed standards than in externally assessed standards? If so, why? • Are the better students (with many Excellence results) not doing as well in external assessments as in internal? If so, why? • Is there any relationship between absences and achievement levels? It seems not, but it’s worth analysing the data to be sure.
Basic analysis • Divide the class into three groups on the basis of overall achievement • Identify students who are doing so well at level 2 that they could be working at a higher level • Find trends for males and females, those who are absent often, or have many detentions • Compare this group’s external assessment success rate with the national cohort.
Making sense of the results This table shows that reading levels overall were higher in term 4 than in term 1. Scores improved for most students. 20% of students moved into Level 5. But the median score is still 4A. Is this information? Can we act on it?
Interrogate the information What effect is the new 6-day x 50-min period structure having on student engagement levels? Do student views align with staff views? Do positive effects outweigh negative effects? Is there justification for reviewing the policy? Does the information imply changes need to be made to teaching practices or techniques? Does the information offer any hint about what sort of changes might work?
Professionals making decisions You asked what factors are related to poor student performance in formal writing. The analysis suggested that poor homework habits have a significant impact on student writing. You make some professional judgements and decide • Students who do little homework don’t write enough • You could take action to improve homework habits - but you’ve tried that before and the success rate is low • You have more control over other factors – like how much time you give students to write in class So you conclude – the real need is to get students to write more often
Evaluate the impact of our action A school created a new year 13 art programme. In the past students had been offered standard design and painting programmes, internally and externally assessed against the full range of achievement standards. Some students had to produce two folios for assessment and were unsure of where to take their art after leaving school. The new programme blended drawing, design and painting concepts and focused on electronic media. Assessment was against internally assessed standards only.
Evaluate the impact of our action • Did students complete more assessments? • Were students gain more national assessment credits? • How did student perceptions of workload and satisfaction compare with teacher perceptions from the previous year? • Did students leave school with clearer intentions about where to go next with their art than the previous cohort? • How did teachers and parents feel about the change?