Download
1 / 66
660 likes | 867 Vues
Waste: The true cost to Schools. Oregon Schools Facilities Management Association April 13, 2011. Dorothy Fisher Atwood Zero Waste Alliance. Following nature's model... Working for the elimination of waste and toxics. - Portland-based non-profit established in 1999 by Larry Chalfan

E N D
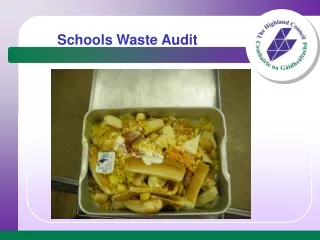
Waste: The true cost to Schools Oregon Schools Facilities Management Association April 13, 2011 Dorothy Fisher Atwood Zero Waste Alliance
Following nature's model... Working for the elimination of waste and toxics. • - Portland-based non-profit established in 1999 by Larry Chalfan • - SOSI – Sustainable Oregon Schools Initiative • Development of standards (e.g. EPEAT, Outdoor Industry) • Management systems implementation: sustainability, environmental (ISO 14001) , energy (ISO 50001)- Direct technical services, waste stream reduction/elimination (PDC Green Gain Program) • www.zerowaste.org
Key Lessons • What is waste • Importance of upstream • Mass Matters • Less consumption is “more” • More money • More environmental benefits • More for future generations • Can’t do zero waste alone
What is Waste? Something we throw away…… ………what else?
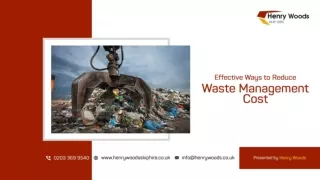
What is Waste? • Something we have purchased and reduced to a value of zero or less • Actions taken that don’t create or add value • Costly - permits, fees, disposal costs, safety risks • A sign of inefficiency and lost money
Waste is…. General Wastes: • Solid Waste - Garbage • Hazardous Waste • Air Emissions • Waste of Resources - Energy, Water, Materials • Waste of Human Resources • Over consumption • Space Manufacturing Wastes 1. Waste from Overproduction 2. Waste of Waiting Time 3. Waste of Transportation 4. Waste in Processing 5. Waste of Inventory 6. Waste of Motion 7. Waste from Product Defects -from Toyota
Zero Waste - Defined Zero Waste is a whole-system approach to redesigning the flow of resources through society. -Warren Snow, Zero Waste New Zealand
What and where are the impacts of waste? Courtesy of David Allaway, DEQ (503) 229-5479 allaway.david@deq.state.or.us
Life Cycle Stages “Downstream” (end of life management) “Upstream” (Production) Use Materials & Materials & Materials & Materials & Materials &
Upstream Impacts • Extraction and harvesting of raw materials • Energy use • Habitat impacts • Pollution and wastes • Product/packaging manufacturing • Energy use • Consumptive water use • Pollution and wastes • Transportation of raw materials, products • Energy use • Pollution
Downstream Impacts • Energy and pollution associated with collection and transportation of waste and recyclables • Leachate from landfills • Methane and other air emissions from landfills • Emissions from incineration • Liner failure • Land, air, and water quality impacts of burning, stockpiling, and illegal dumping of garbage (not well quantified)
Tellus Institute Packaging Study (1992) • Prepared for the Council of State Governments, U.S. EPA, and State of New Jersey. • Relied solely on public sources of information. • Evaluated and “monetized” human health impacts of emissions not captured by pollution control devices.
Tellus Study Results (continued) Note: These costs are per-ton, not per-package!
What does all this mean? The first R, Reducing, ie – preventing waste by reducing consumption has the largest benefit by many times.
Solid Waste Policy in Oregon • Waste management hierarchy: • Reduce (prevent waste), then • Reuse, then • Recycle, then • Compost, then • Recover energy, then • Landfill
Comparison: Prevention and Recycling • Recycling reduces upstream impacts. • Prevention (reducing so not consuming) eliminates upstream impacts.
Bags and Boxes • Boxes have recyclability and recycled-content advantages over most types of bags. • But bags have waste prevention advantages over boxes (for non-breakable items), due to lower weight (less mass). • Different types of bags and void fills for boxes exist – can we state with any certainty that one general approach is better than the other, from a cross-media perspective? • Do different options shift pollution from solid waste to a different medium?
Common Business Perceptions • The choice of void fill is the most important environmental choice. • Plastic is “made from oil” and is therefore “bad”. • By extension, products not made from oil aren’t “bad” (or as bad). • Downstream (disposal) impacts are more important, than upstream (manufacturing) impacts. • Wastes that biodegrade are inherently “good”. • Recyclability is important.
DEQ Packaging Study: Materials Evaluated *Different levels of post-consumer content also evaluated. ONP = Old newspaper
Results: Atmospheric Fossil Derived Carbon Dioxide* *Landfill, waste incineration, and forestry-related emissions not included.
Mass Matters • Weight of materials used is a critical factor: • All bags evaluated have lower burdens than boxes (in most categories) because of their much lower weight. • This confirms the relative ranking of waste prevention and recycling in the waste management hierarchy. • Recyclability and recycled content are not always the best predictor of life cycle energy use or emissions: • BUT, once you’ve chosen a packaging material, increasing post-consumer content and recycling opportunities can have benefits.
Please . . . . . . don’t interpret the study as being “anti-paper” . . . don’t interpret the study as being “anti-box” . . . don’t interpret the study as being “anti recycling” or “anti-recycled content”
Comparison: Reuse and Recycling • Reuse = using a product in its original form, without the repulping, melting, grinding, or other mechanical or chemical reformulation associated with recycling. • Benefits of reuse are typically greater than the benefits of recycling. For example: • Reusing a personal computer saves 5 - 20 times more energy than recycling it. • Reusing a corrugated box saves 3 - 4 times more energy than recycling it, and may save the business 5 - 10 times more money.
Net Energy Savings from Recycling • Aluminum Cans: 207 MM BTU/ton • Carpet: 106 MM BTU/ton • HDPE/LDPE: 51 – 56 MM BTU/ton • PET: 53 MM BTU/ton • Personal computers: 44 MM BTU/ton • Steel cans: 20 MM BTU/ton Source: US EPA
Net Energy Savings from Recycling (continued) • Newsprint: 17 MM BTU/ton • Corrugated: 16 MM BTU/ton • Phone books: 12 MM BTU/ton • Office paper: 10 MM BTU/ton • Glass: 2.7 MM BTU/ton • Magazines/third class mail: 1.1 MM BTU/ton • Aggregate: 0.6 MM BTU/ton Source: US EPA
How Much Energy Does Oregon Save by Recycling? • Recycling in Oregon in 2007 saved ~30 trillion BTUs of energy • ~2.7% of total statewide use • Equivalent of ~241 million gallons of gasoline • Recovery in Oregon in 2007 reduced greenhouse gas emissions by ~3.6 million tons of CO2e • ~5.1% of total statewide emissions • Equivalent of 770,000 “average” passenger cars
What is Zero Waste? • Goals: - Closed Loops or “Cradle to Cradle”- Goal: 100% resource efficiency, no released toxics • Drives Design- Design for the Environment- Design for End-of-Life Management • The concept acknowledges that our “Take-Make-Waste” society is compromising nature’s ability to provide for us and future generations
Today’s Industrial System Nature’s Cycles Industrial System
Goal: Society’s Cycles: Closed- Loop Biodegradable Non-biodegradable Zero Waste’s System View Nature’s Cycles: Cyclical, No Waste!
Zero Waste Leader • Epson Portland Inc. • Zero Waste to Landfill as of March 2001 • 90% diversion, 4.5M lbs in 2000 • 10% to energy recovery for electricity generation • Since its baseline year of 1997 • Reduced total waste by 37%, • Reduced VOC emissions by 96%, • Reduced hazardous waste by 24% • Saved $308,000 in 2000 via Zero Waste to landfill through recycling.
Zero Waste supports the triple bottom line Economic Sustainability •Waste reduction improves efficiency and lowers costs • Costs of compliance with regulations is reduced Environmental Sustainability • Reduces demand for resources and energy from nature • Reduces wastes to nature Social Sustainability • More resources and energy become available for others • Closing the loop (cradle-to-cradle) generates new jobs
Sustainability and Zero Waste Sustainability is a vision • Considers future generations • Doesn’t tell us what to do A Zero Waste Strategy • Visionary, stretch endpoint (not a short-term goal) • Looks at all processes, products, activities and services • Utilizes tools of industrial ecology, LCA, DfE, EMS, etc.
Approaches and Support Tools • Life-Cycle Assessment (LCA) • Design for the Environment (DfE) • Green Chemistry • Environmental Management Systems (EMS) • Product Stewardship/Extended Producer Responsibility (EPR) • Supply Chain Management • Full Cost Accounting (FCA) • Pollution Prevention (P2) • Resource Flow Mapping • Waste Exchanges and Eco-Industrial Parks
Steps to Zero Waste • Understand Current Conditions • Map resource flows • Do a waste audit • Create a Zero Waste Vision of your organization • Set goal with target date and interim milestones • Select metrics • Identify Potential Zero Waste Opportunities • Prioritize and select • Implement, monitor, measure, check back